A Forecasting Analysis of Inventory Costs
Table of Contents

One of the biggest problems companies have when dealing with inventory is to predict the optimal level of future inventory stock, to be in a better position against the fluctuations of supply and demand. Not only does this regard the costs associated with overstocking unsold items, but also the possibility of missed sales opportunities when demand outstrips supply. This article shows the forecasting results of future stock inventory for certain sub-categories of products for a small start-up that I recently worked at.
Data Summary #
The problem of predicting stock inventory is a well known problem for companies, and has been confronted in operations management and applied economics where it is known as the news vendor problem. The problem is characterized by fixed prices and an uncertain demand for time-sensitive products.
The data that was used for this analysis derives from proprietary sales data from a small but promising online retail fashion start-up that I recently had the opportunity to work for. As part of the data science team in this company, one of the major hurdles we had was to determine stock from sales rather than relying on past inventory. The goal of our work was to suggest opportunities to reduce overstocking costs and increase understocking to make the best of sales opportunities.
Exploratory Data Analysis #
Table 1 represents the five sub-categories of products where the positive difference between overstocking and understocking costs are the highest. In the case of a positive difference between overstocking and understocking costs, keeping unsold items in stock is more expensive than the potential revenue derived by the opportunity of selling them.
| Sub-category | Mean item price (£) | Mean item cost (£) | Overstocking cost (£) | Understocking cost (£) | \(\Delta\) (£) |
|---|---|---|---|---|---|
| Watches | 163.32 | 96.98 | 102.22 | 61.10 | 41.12 |
| Electronics | 163.09 | 96.32 | 101.56 | 61.53 | 40.03 |
| Eyewear | 65.18 | 41.54 | 46.78 | 18.40 | 28.38 |
| Bags | 46.74 | 24.99 | 30.23 | 16.51 | 13.72 |
| Sports Equipment | 12.29 | 7.46 | 12.70 | -0.41 | 13.11 |
In some cases, such as the sport equipment sub-category, even the potential sale of these items would result in a loss (as shown in the understocking cost field), since the company fails to make money on this particular sub-category. Figure 1 below shows the top five sub-categories where the positive difference between overstocking and understocking costs are highest.
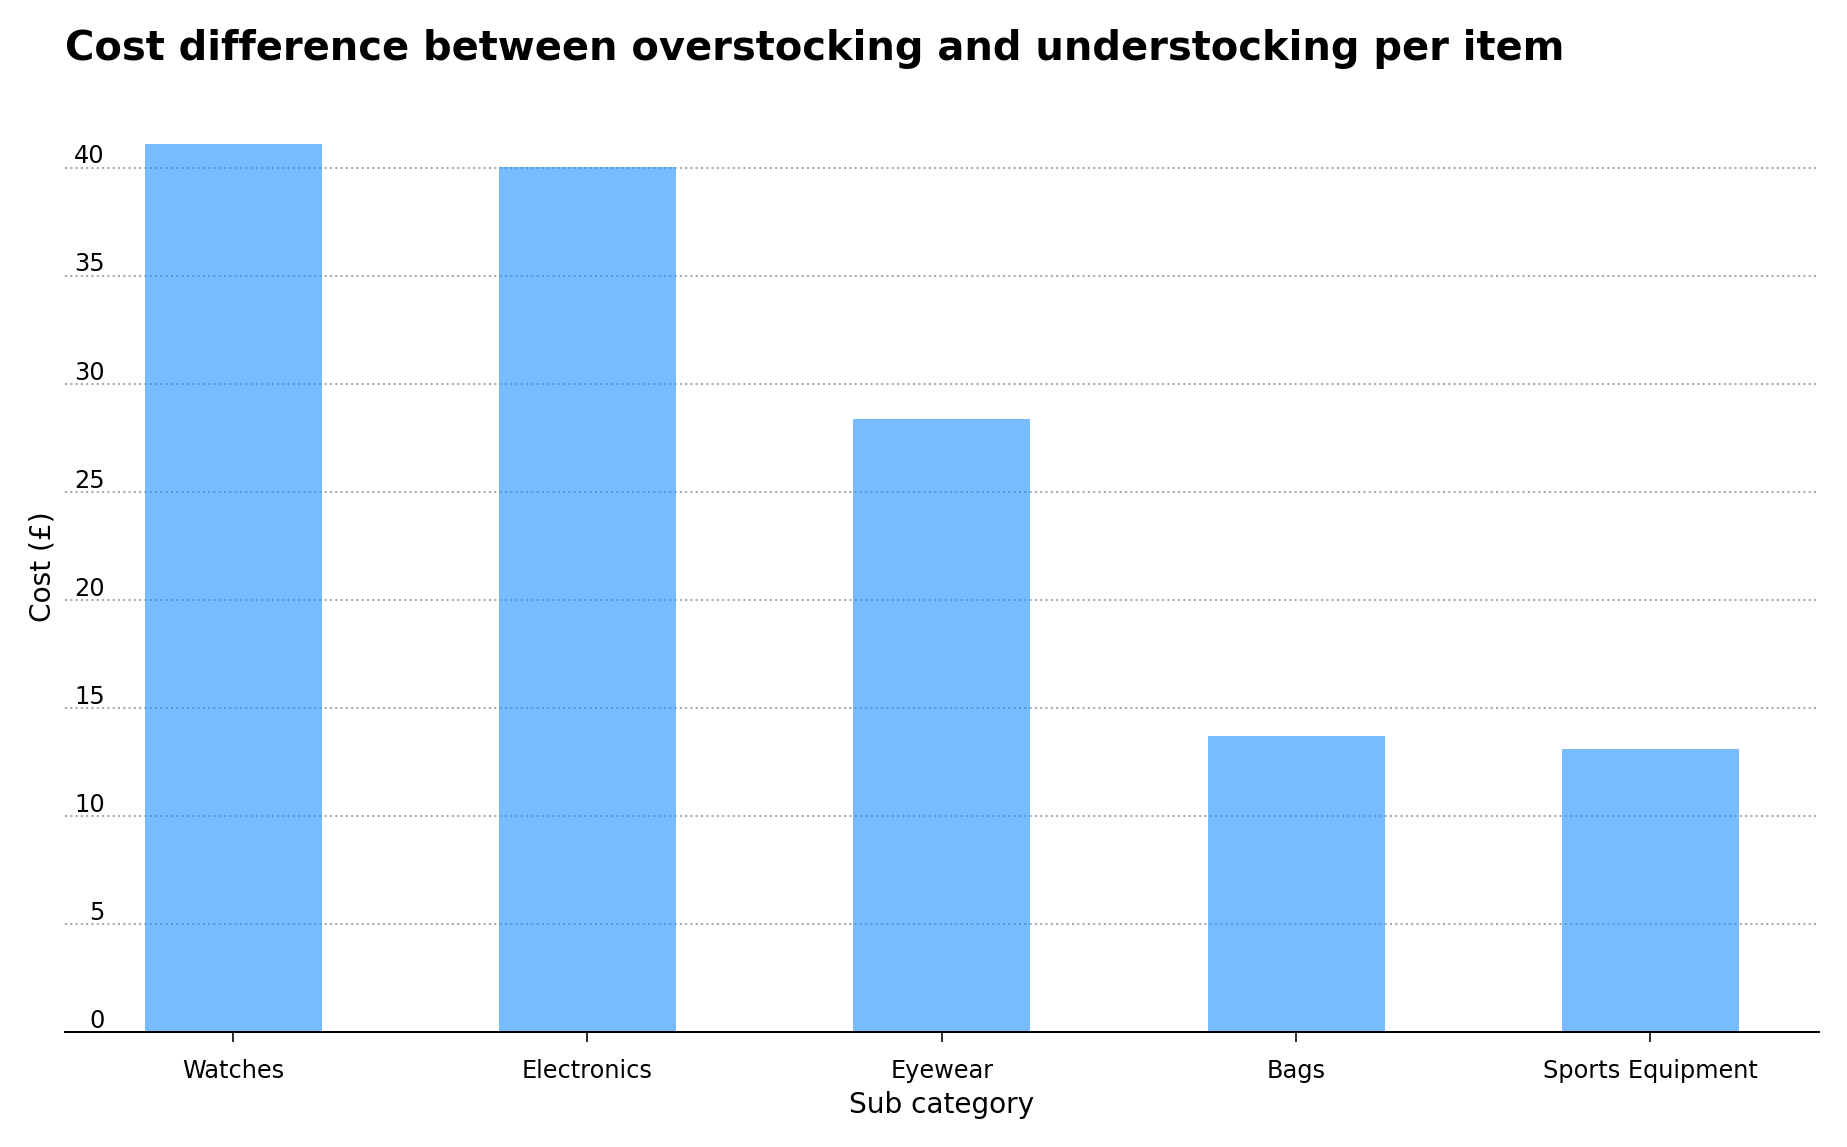
Figure 1 – Positive difference between overstocking and understocking costs for the top five sub-categories.
Likewise, we need to consider the case for the sub-categories where the difference between overstocking and understocking costs are lowest. This in particular pertains to the suits and perfumes sub-categories, as shown in Table 2.
| Sub-category | Mean item price (£) | Mean item cost (£) | Overstocking cost (£) | Understocking cost (£) | \(\Delta\) (£) |
|---|---|---|---|---|---|
| Suits | 61.61 | 22.72 | 27.96 | 33.65 | -5.69 |
| Perfume | 63.38 | 25.66 | 30.90 | 32.48 | -1.58 |
| Coats | 70.26 | 30.76 | 36.00 | 34.25 | 1.75 |
| Other Homewear | 12.33 | 3.18 | 8.42 | 3.92 | 4.50 |
| Vests | 38.50 | 16.35 | 21.59 | 16.91 | 4.68 |
These two sub-categories don’t cost much to keep in stock but represent a greater loss in missed sales opportunities, due to their high margins. However, only these two sub-categories represent a potential sales opportunity if kept in stock, as the difference between overstocking and understocking costs becomes positive for all other sub-categories in the table, and therefore represent an overstocking cost if unsold.
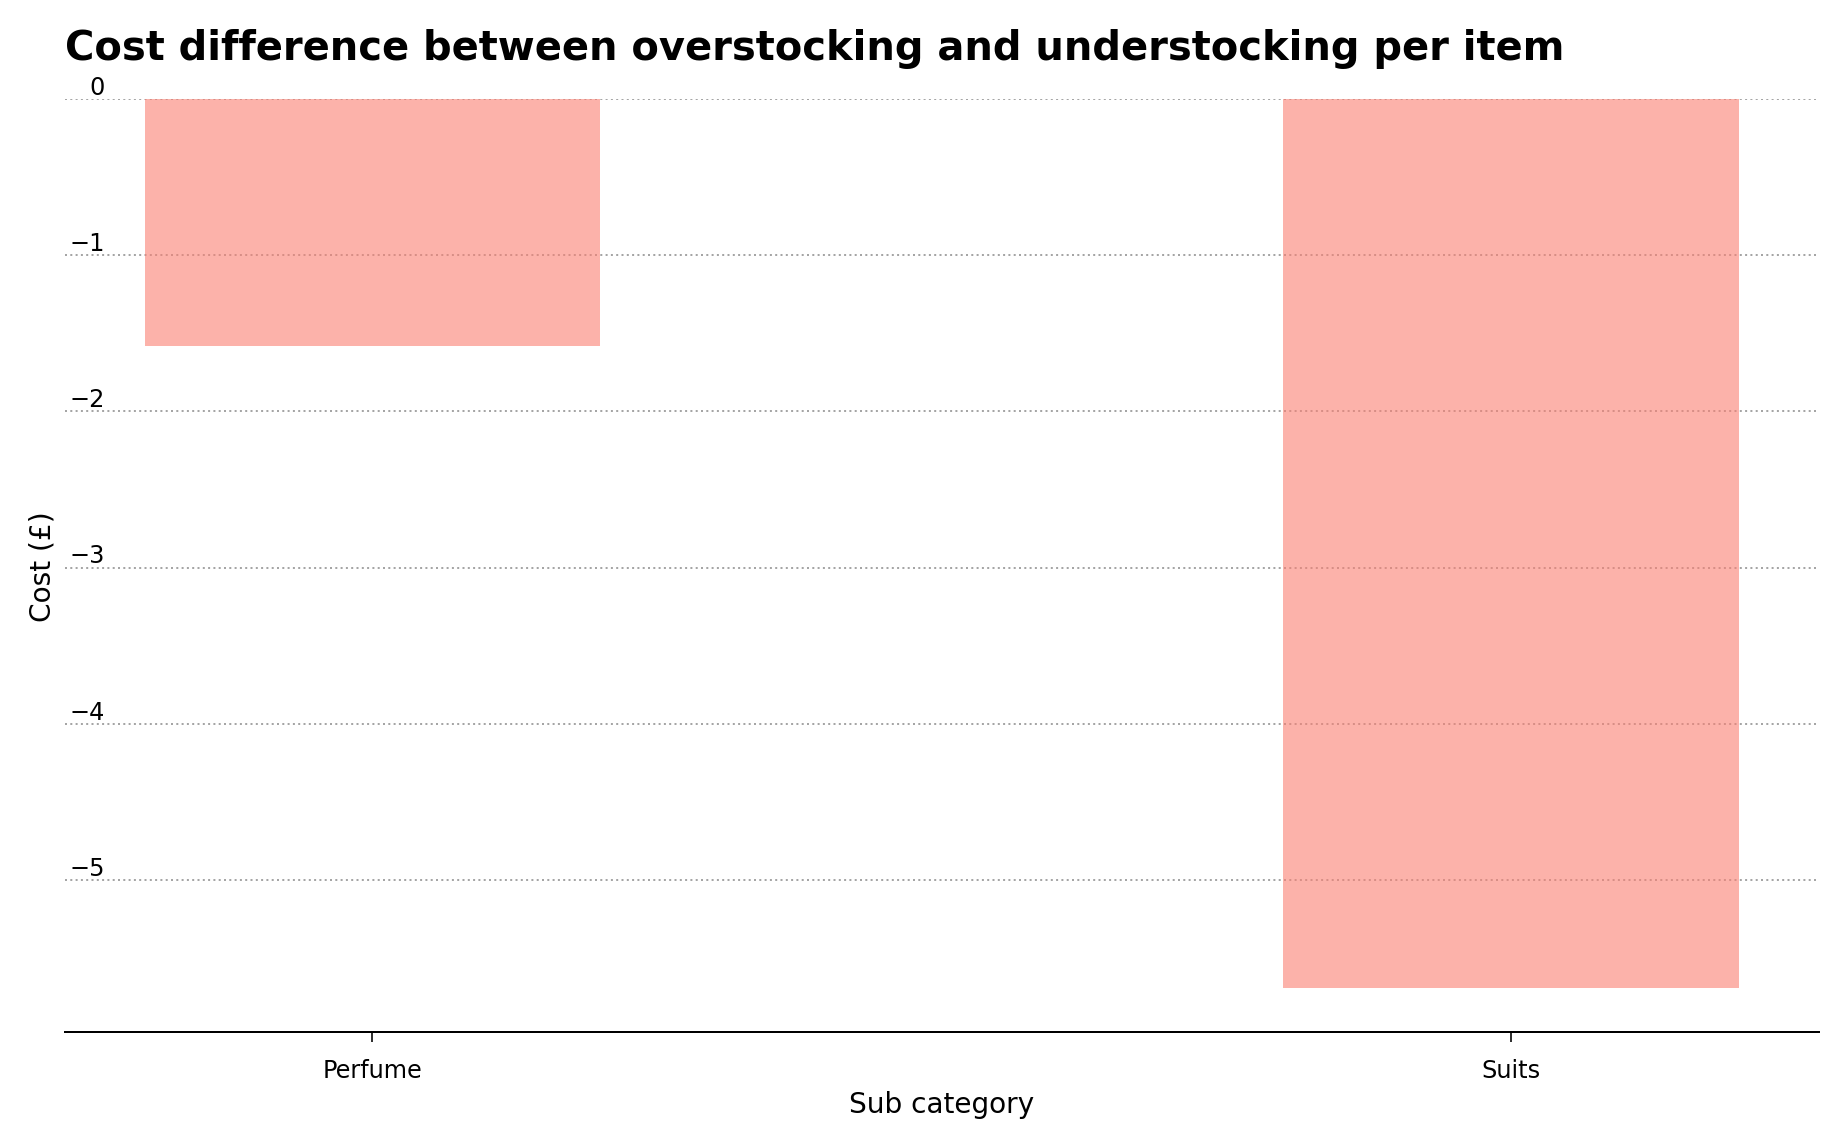
Figure 2 – Negative difference between overstocking and understocking costs for the top two sub-categories.
Figure 2 above shows the top two sub-categories where the negative difference between overstocking and understocking costs are greatest.
Model Analysis #
I’ve selected to illustrate the time series forecasts of a few sub-categories, two from Figure 1 (watches and eyewear) and the first sub-category from Figure 2 (suits). The modeling tool used to create these forecasts is Facebook Prophet, a open-source, time-series analysis package developed by Meta.
For the modeling, the analysis procedure took into account the seasonality effects corresponding to the holidays in the United Kingdom. Moreover for consistency, all of the outliers that were above the 77.5% percentile and below the 22.5% percentile were removed in the forecasting procedure. These outliers are however retained in the historical data shown in the plots below.
In the first two cases, since the overstocking costs are greater than the understocking costs, the recommendation is to keep an number of articles in stock between the lower 95% confidence level and the mean of the forecast, which is represented in the figure by the darker-shaded pink area in Figures 3 and 4.
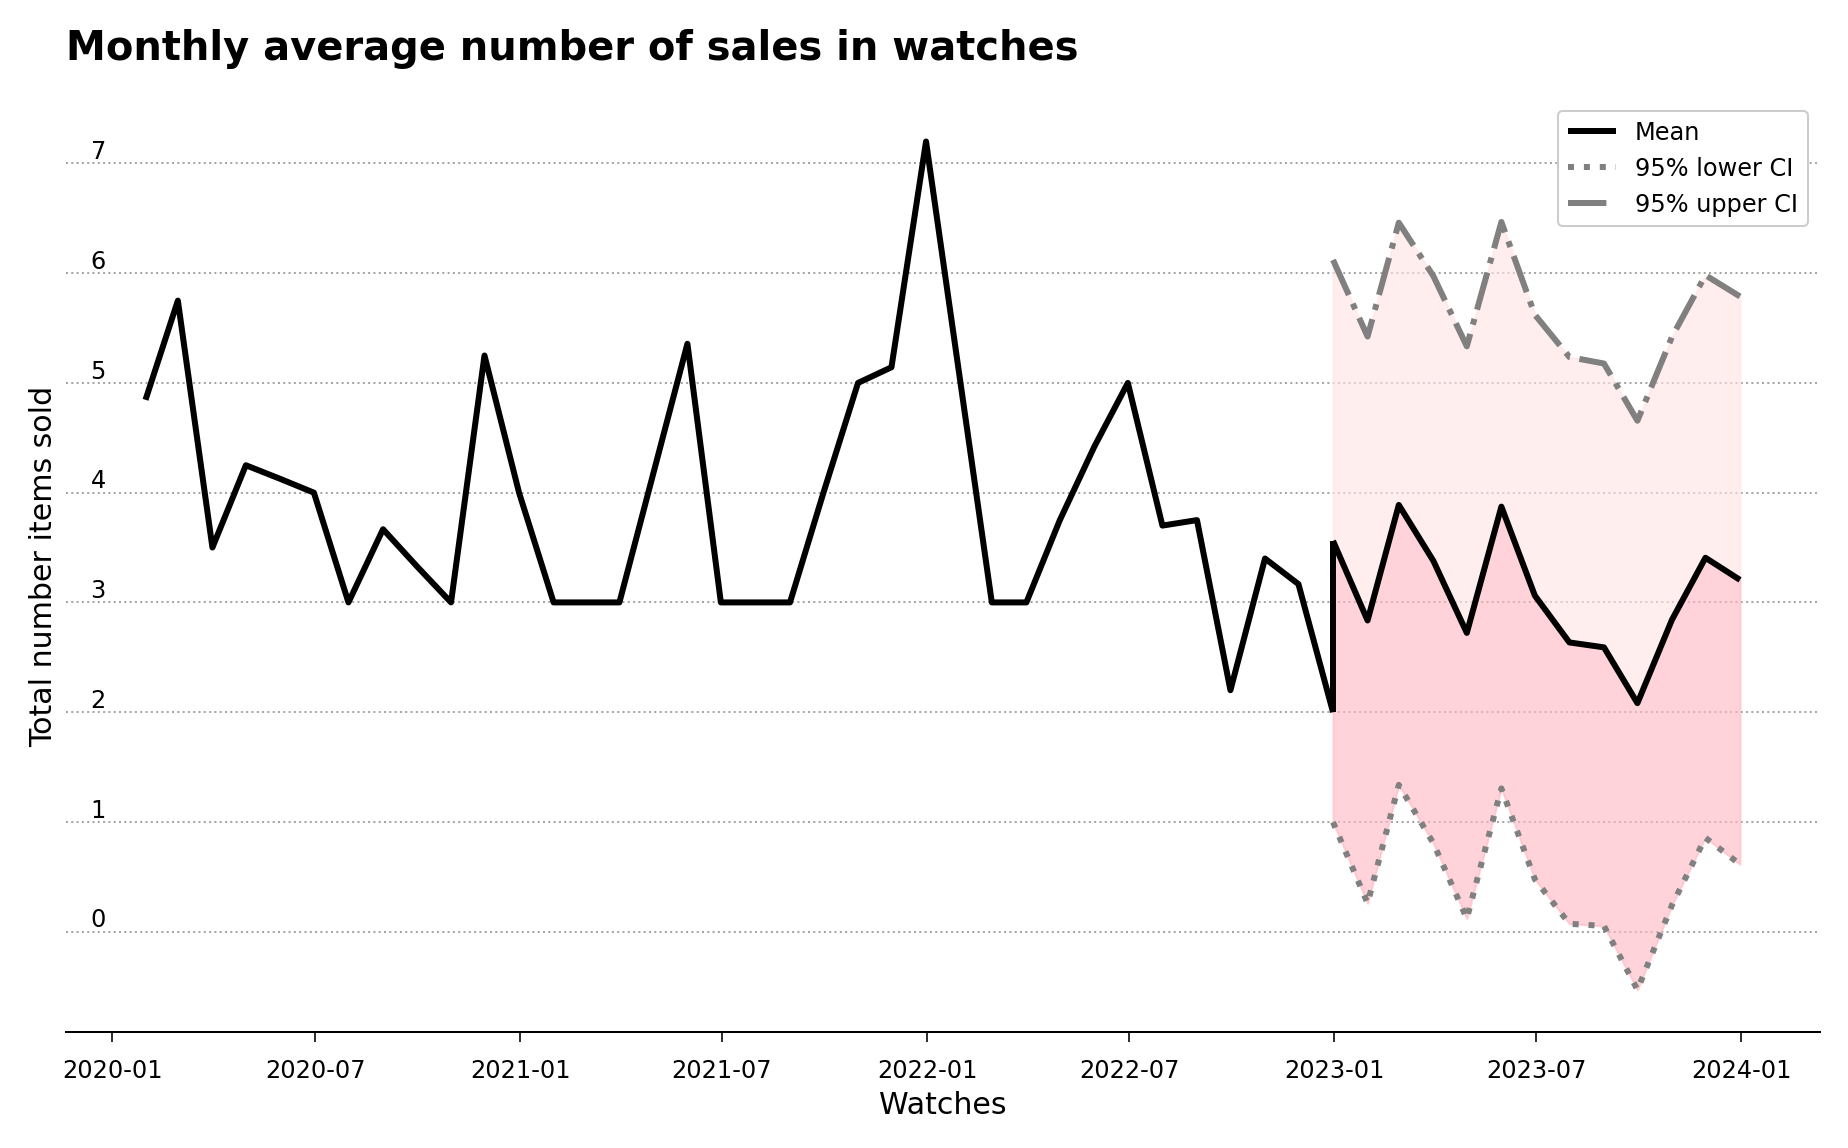
Figure 3 – Historical and forecast data for the watches sub-category for the period spanning 2020 to 2024, with the recommended darker-shaded pink area.
Unfortunately, the data available for the electronics sub-category was too sparse to create a realistic forecast, and so it wasn’t included in the report.
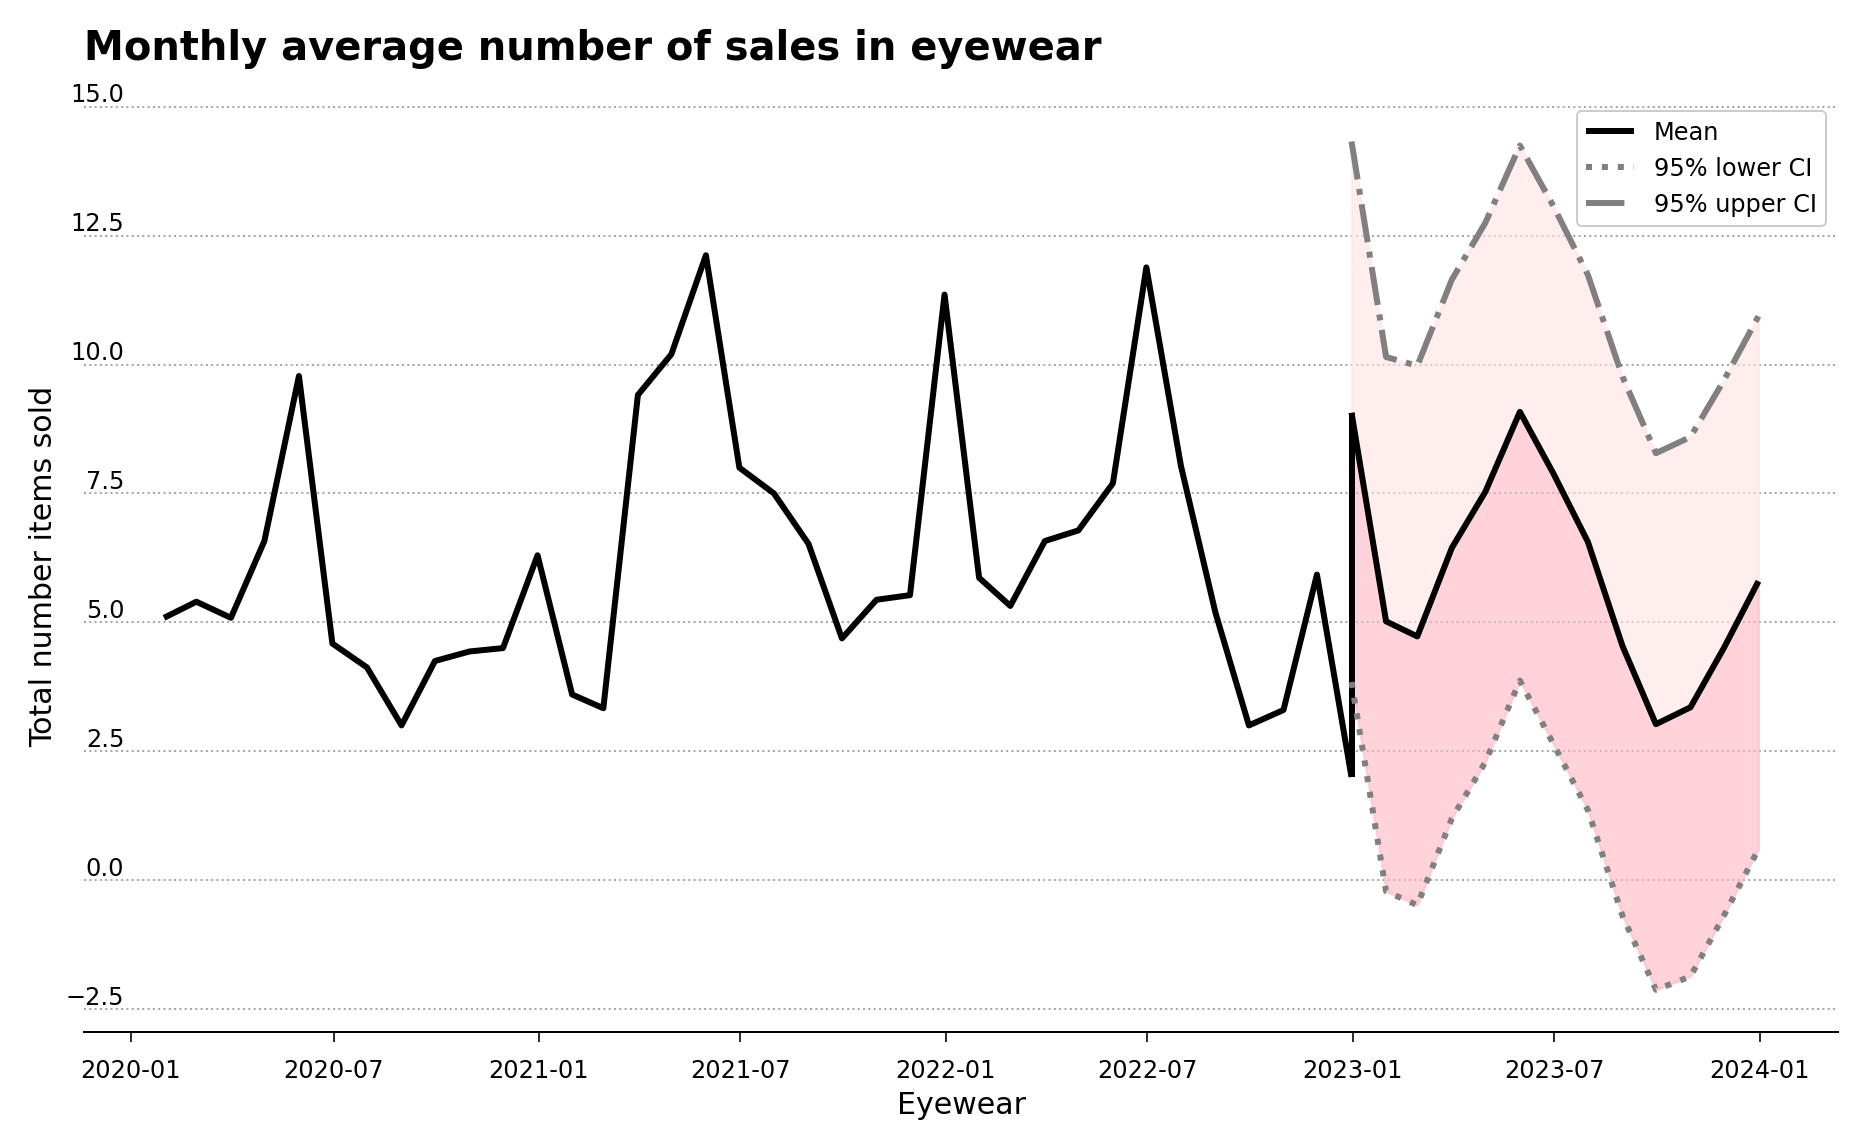
Figure 4 – Historical and forecast data for the eyewear sub-category for the period spanning 2020 to 2024, with the recommended darker-shaded pink area.
In this other case, since the understocking costs are greater than the overstocking costs, the recommendation is to keep an number of articles in stock between the mean and the upper 95% confidence level of the forecast, which is represented in the figure by the darker-shaded blue area in Figure 5.
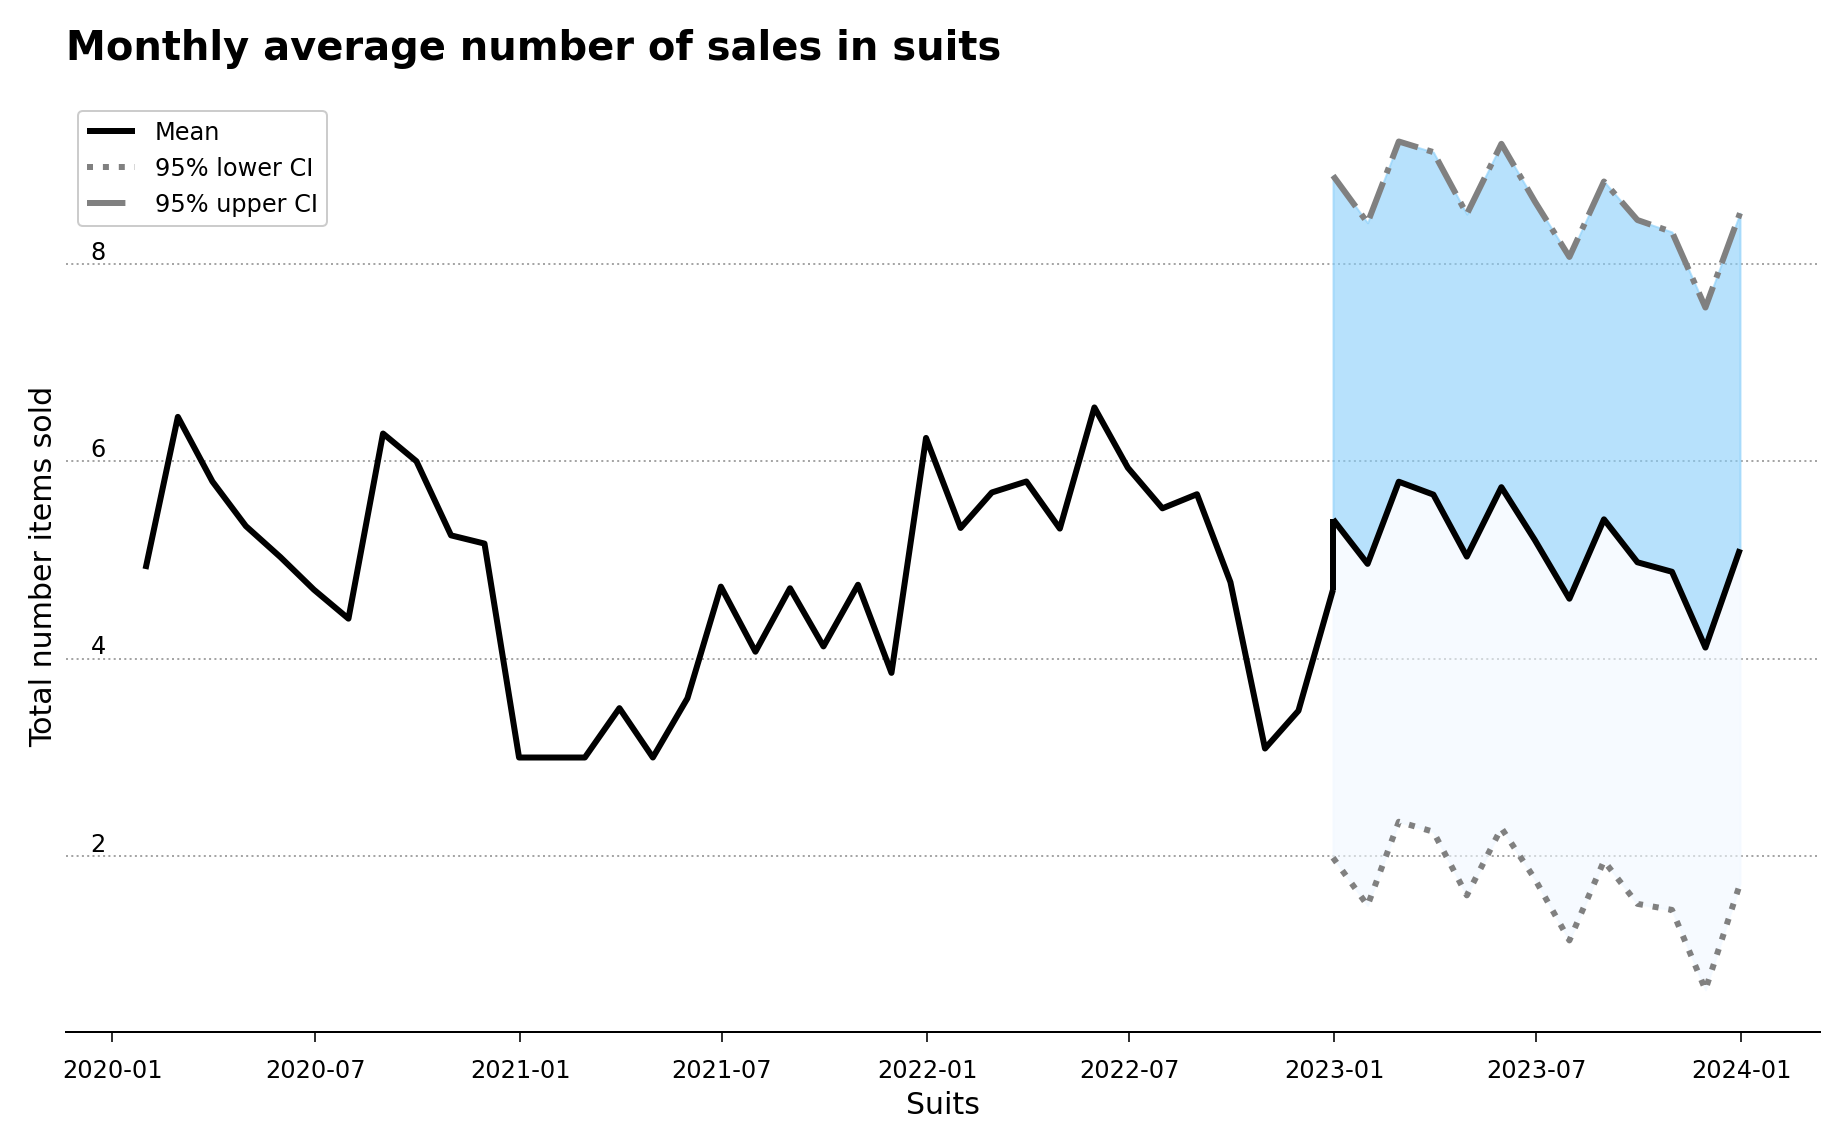
Figure 5 – Historical and forecast data for the suits sub-category for the period spanning 2020 to 2024, with the recommended darker-shaded blue area.
Conclusions #
A lot of simplifications were made to create these forecast analyses. Due to the high number of individual items in the company database (over 9000), it was preferred to concentrate the analysis on the sub-category level and simply use the average item price for each sub-category. Other item costs such as discounts and advertising weren’t taken into account in the forecast prediction. However even with these simplifications, a simple and easily understandable guideline to estimate stock item numbers was achieved.
You are more than welcome to take a look at the Jupyter notebook in my GitHub repository. For the analysis, the following software packages were used: Facebook Prophet (version 1.1.5), pandas (version 1.5.3) and matplotlib (version 3.7.1). In addition, Google BigQuery and Google Colaboratory were also used for the analysis.
I wish to thank the data science team members for their help and insight. Without them, the analysis in its current form wouldn’t have been possible.