Summary #
This interesting project shows a series of interesting bicycle usage patterns as shown in the plots below, such as the average bicycle duration on weekdays and weekends, the total and average number of rides on weekdays and weekends per month, and the ratio of number of rides on weekdays to weekends per month.
Introduction #
The public bicycle sharing scheme has been in use in London for just over ten years now, since it was first introduced by the then mayor of London Boris Johnson in July 2010. It has had a slow but steady increase in use and popularity over the course of the years, such that there is a plan to further increase the number of dock stations and bicycles currently in use to cover a larger area of the downtown and nearby boroughs of the city. The bicycle usage by London city residents is most definitely an interesting project in data analysis and visualization in itself, given particularly that the data is freely available for public consumption on the TfL web site.
Results #
A first approach to the data analysis can be taken with the plot of the total number of bicycle rides per day over 2019 (Figure 1). It is more than apparent the rise in bicycle use from the colder months of winter to the warmer season. Unsurprisingly, some of the more extreme outliers in the plot come not only from days with good or bad weather but also from holidays like Christmas.
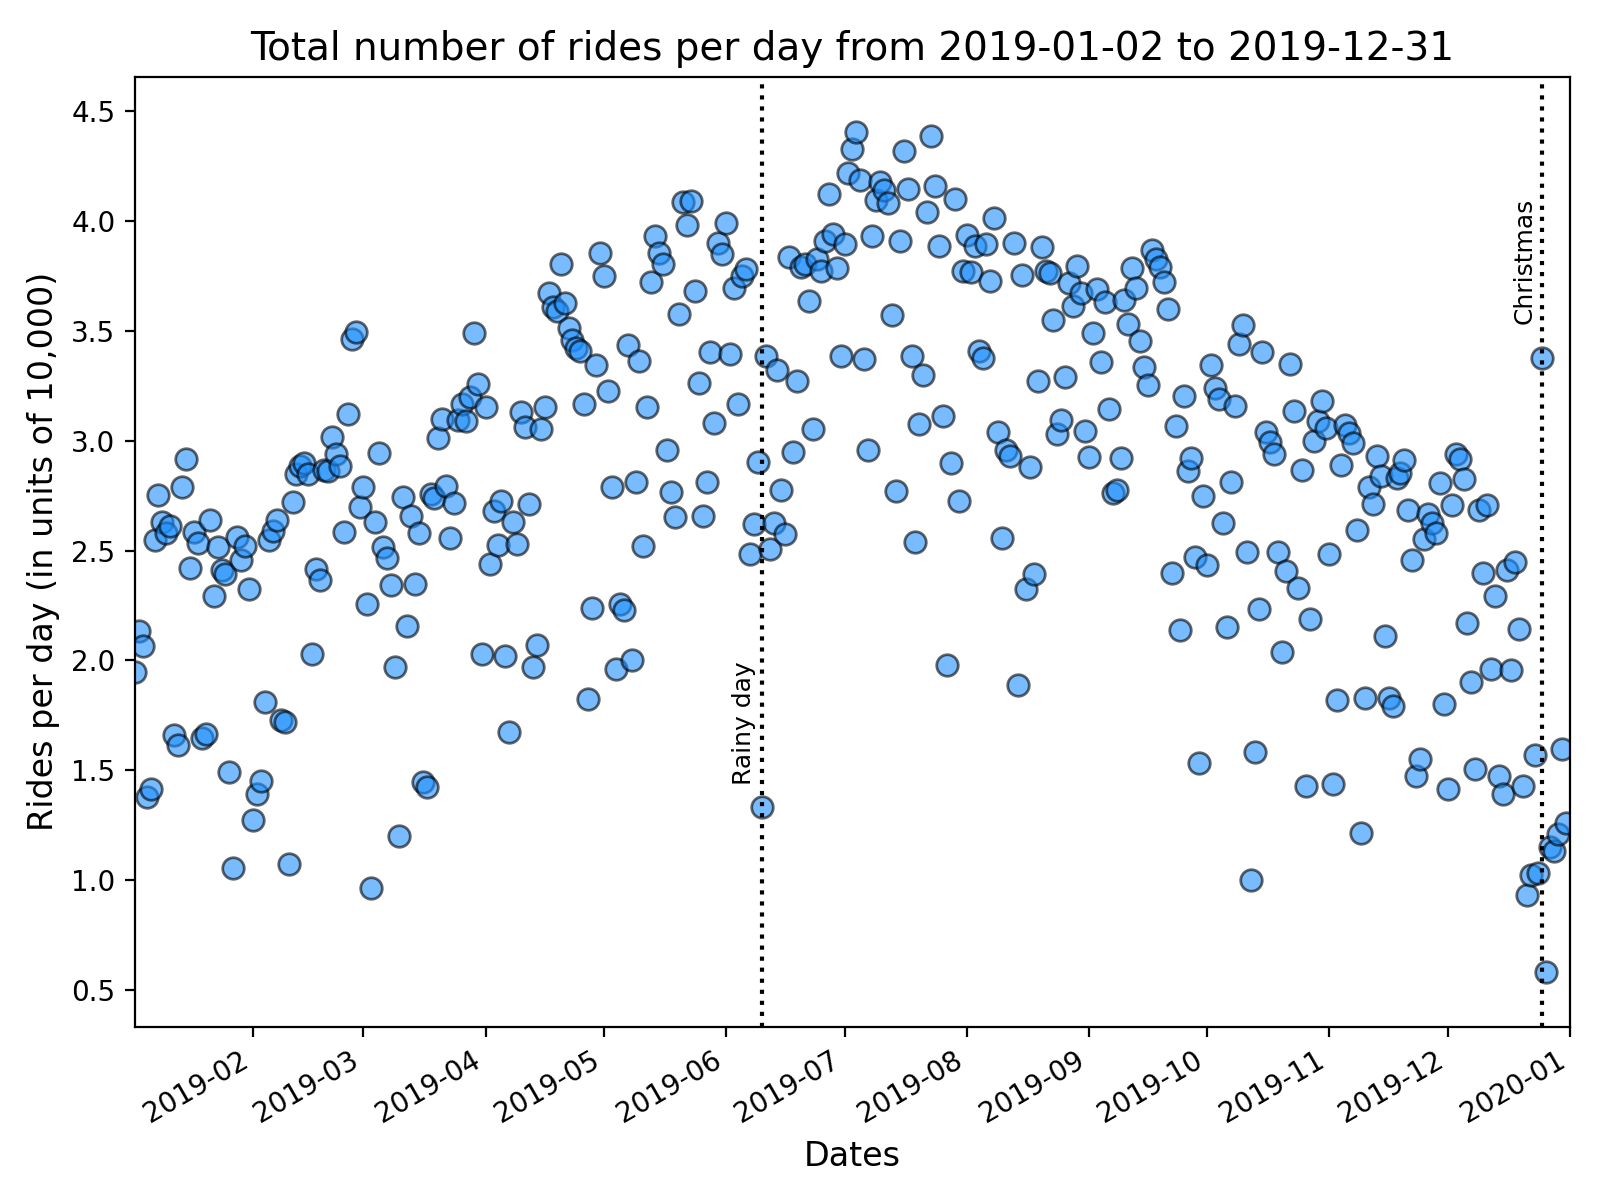
Figure 1 – Total number of rides per day for 2019.
In the next plot in Figure 2 we can see that the average duration of bicycle rides on weekdays is just under 18 minutes. The histogram presents an asymmetric normal distribution, with shorter rides being more prevalent than longer ones.
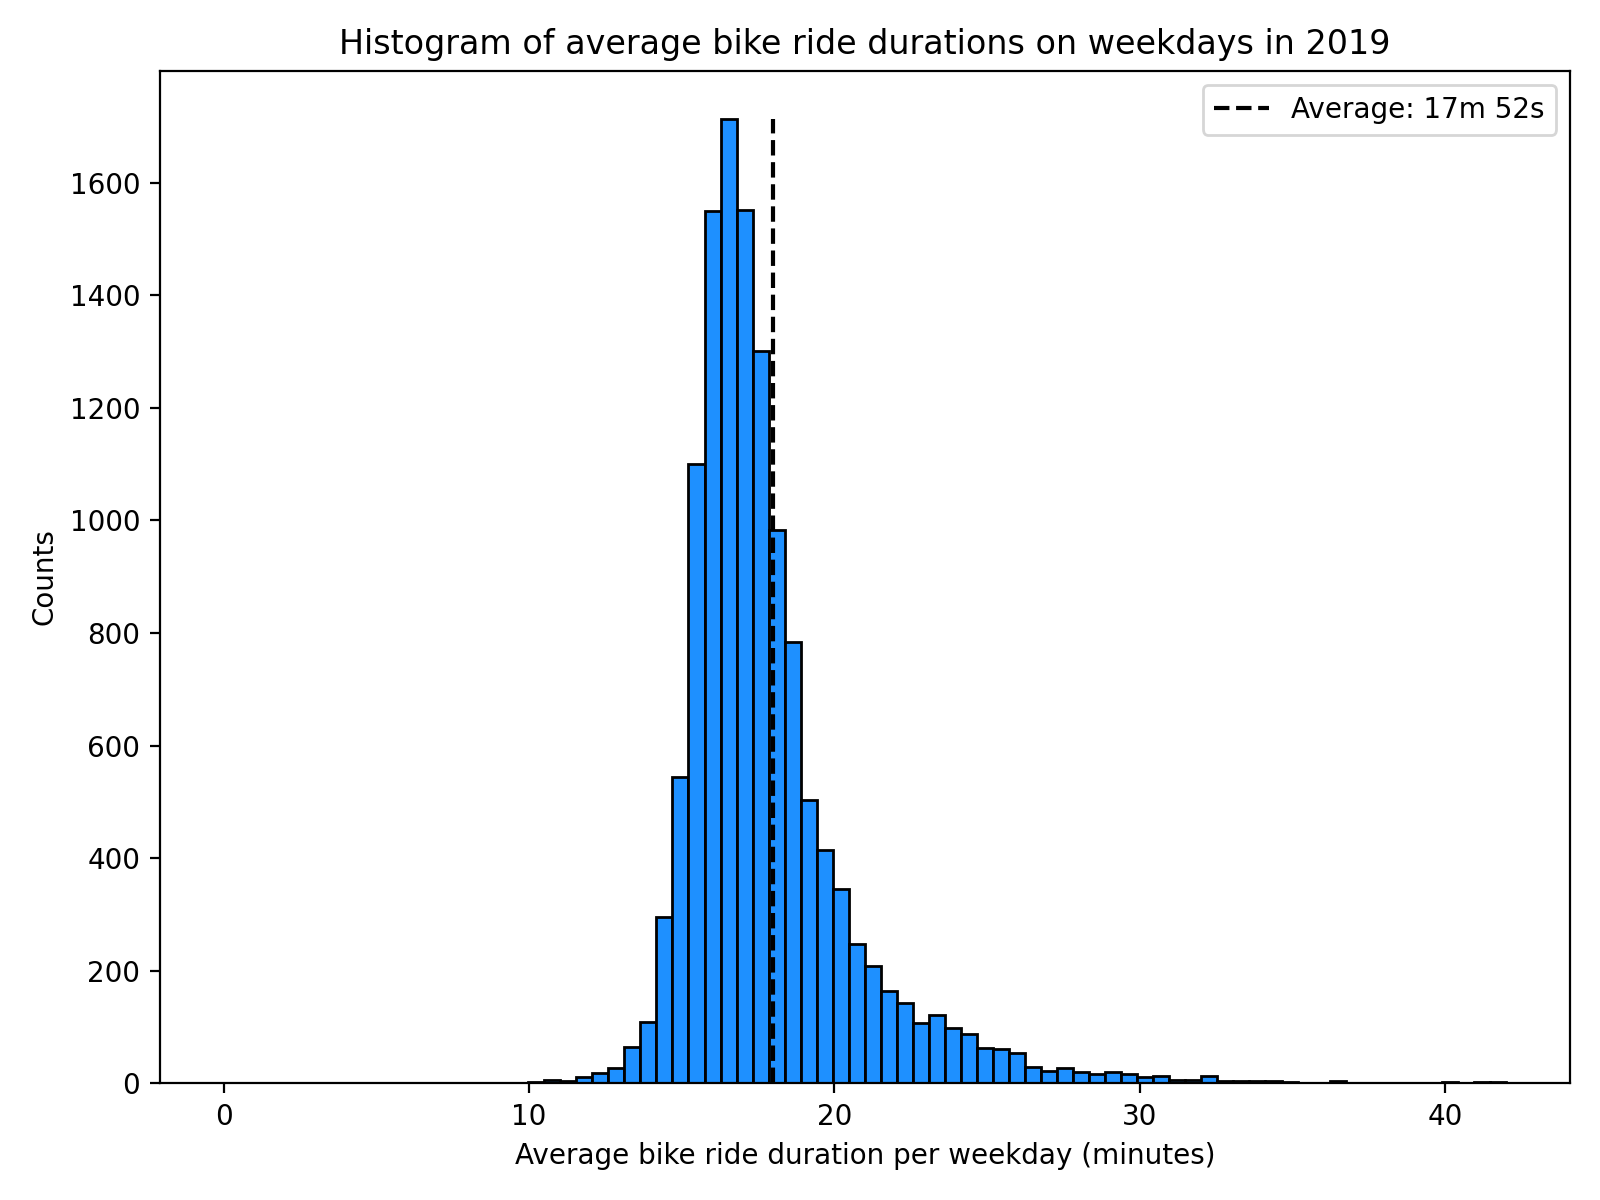
Figure 2 – Histogram of average bike ride duration on weekdays in 2019.
On the other hand, the average duration of bicycle rides on weekends is over 25 minutes, with the same asymmetric histogram distribution (Figure 3). Naturally, the longer average bike duration reflects the greater amount of time for leisure over the weekends.
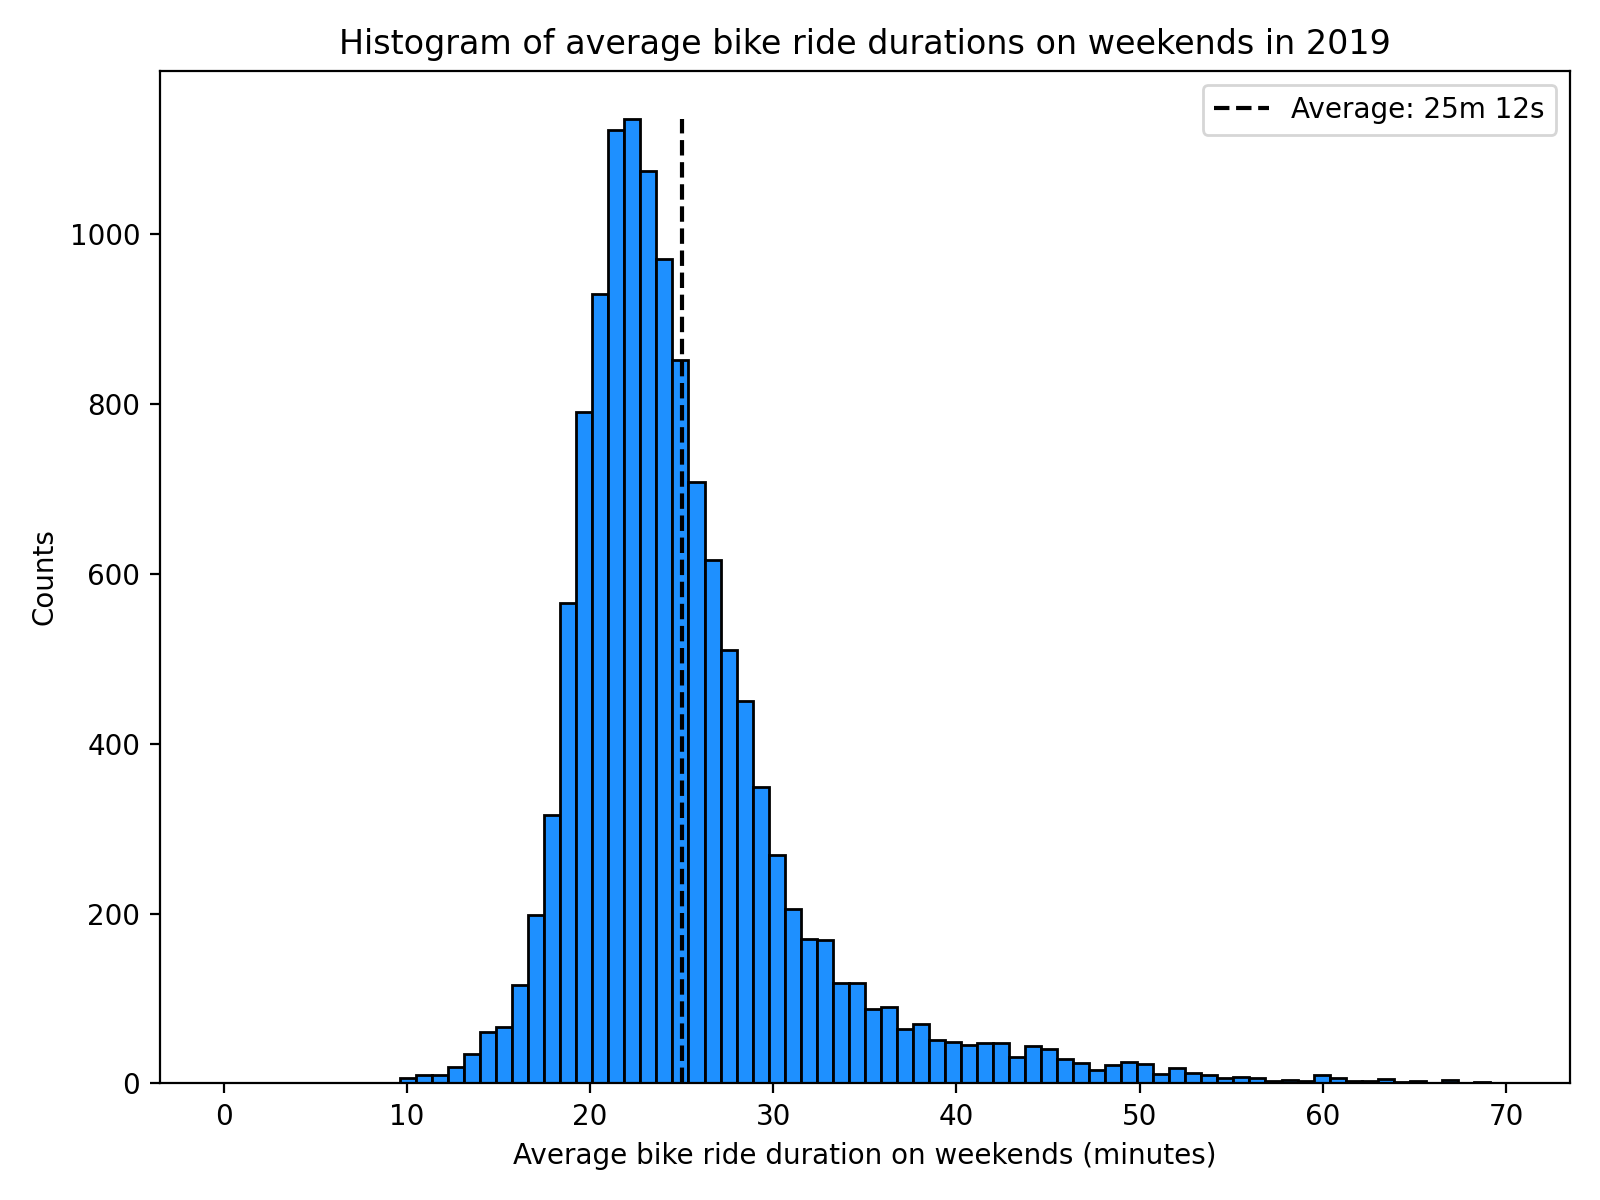
Figure 3 – Histogram of average bike ride duration on weekends in 2019.
The total number of rides per month in 2019 can be observed in the plot below in Figure 4. Here you can notice the rise in bicycle use from winter to summer, and you can also notice an increase in bicycle use over the course of the weekends following the same trend from winter to summer and back. The peak of total bicycle use occurs in July, although June shows a greater use in bicycle rides on weekends compared to weekdays.
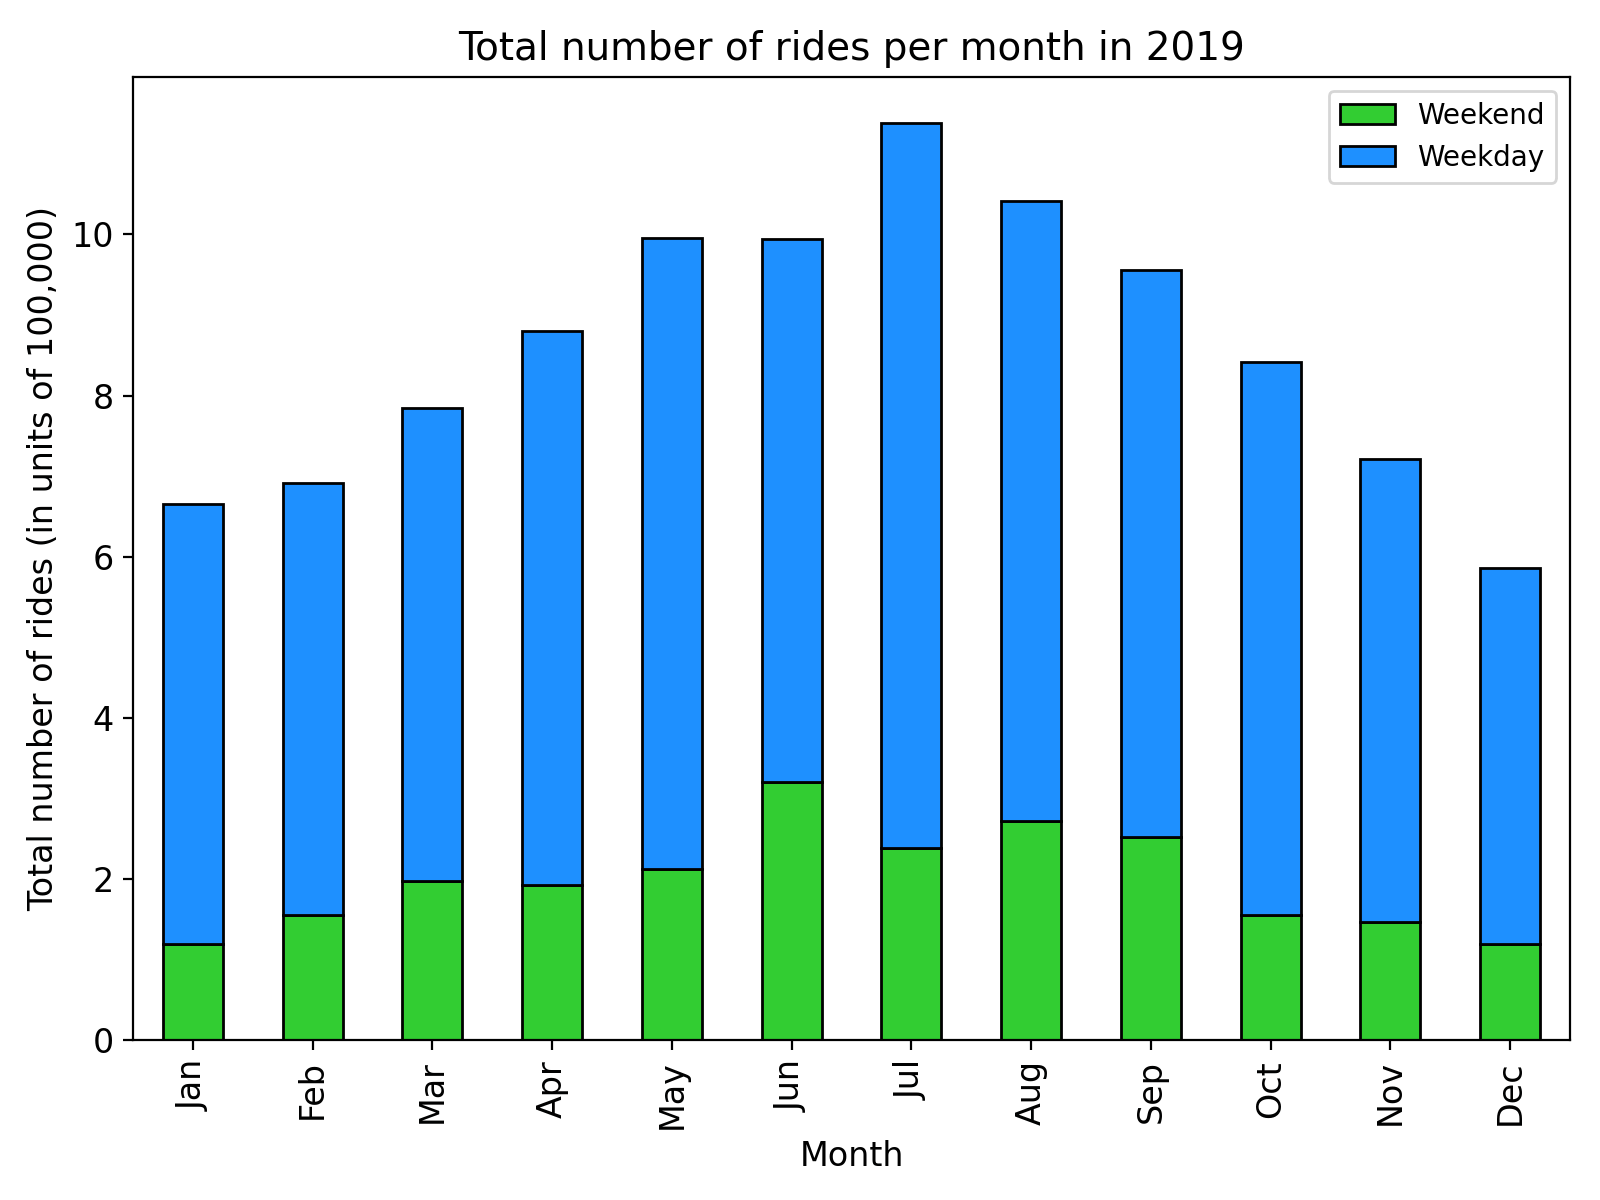
Figure 4 – Total number of rides by month in 2019.
This last observation becomes more apparent in the following plot in Figure 5. The ratio of weekday to weekend rides in 2019 shows the peak demand for bicycles during the weekends of June. In general one can notice a slow uptick in weekend demand during the summer months compared to the demand in the colder season.
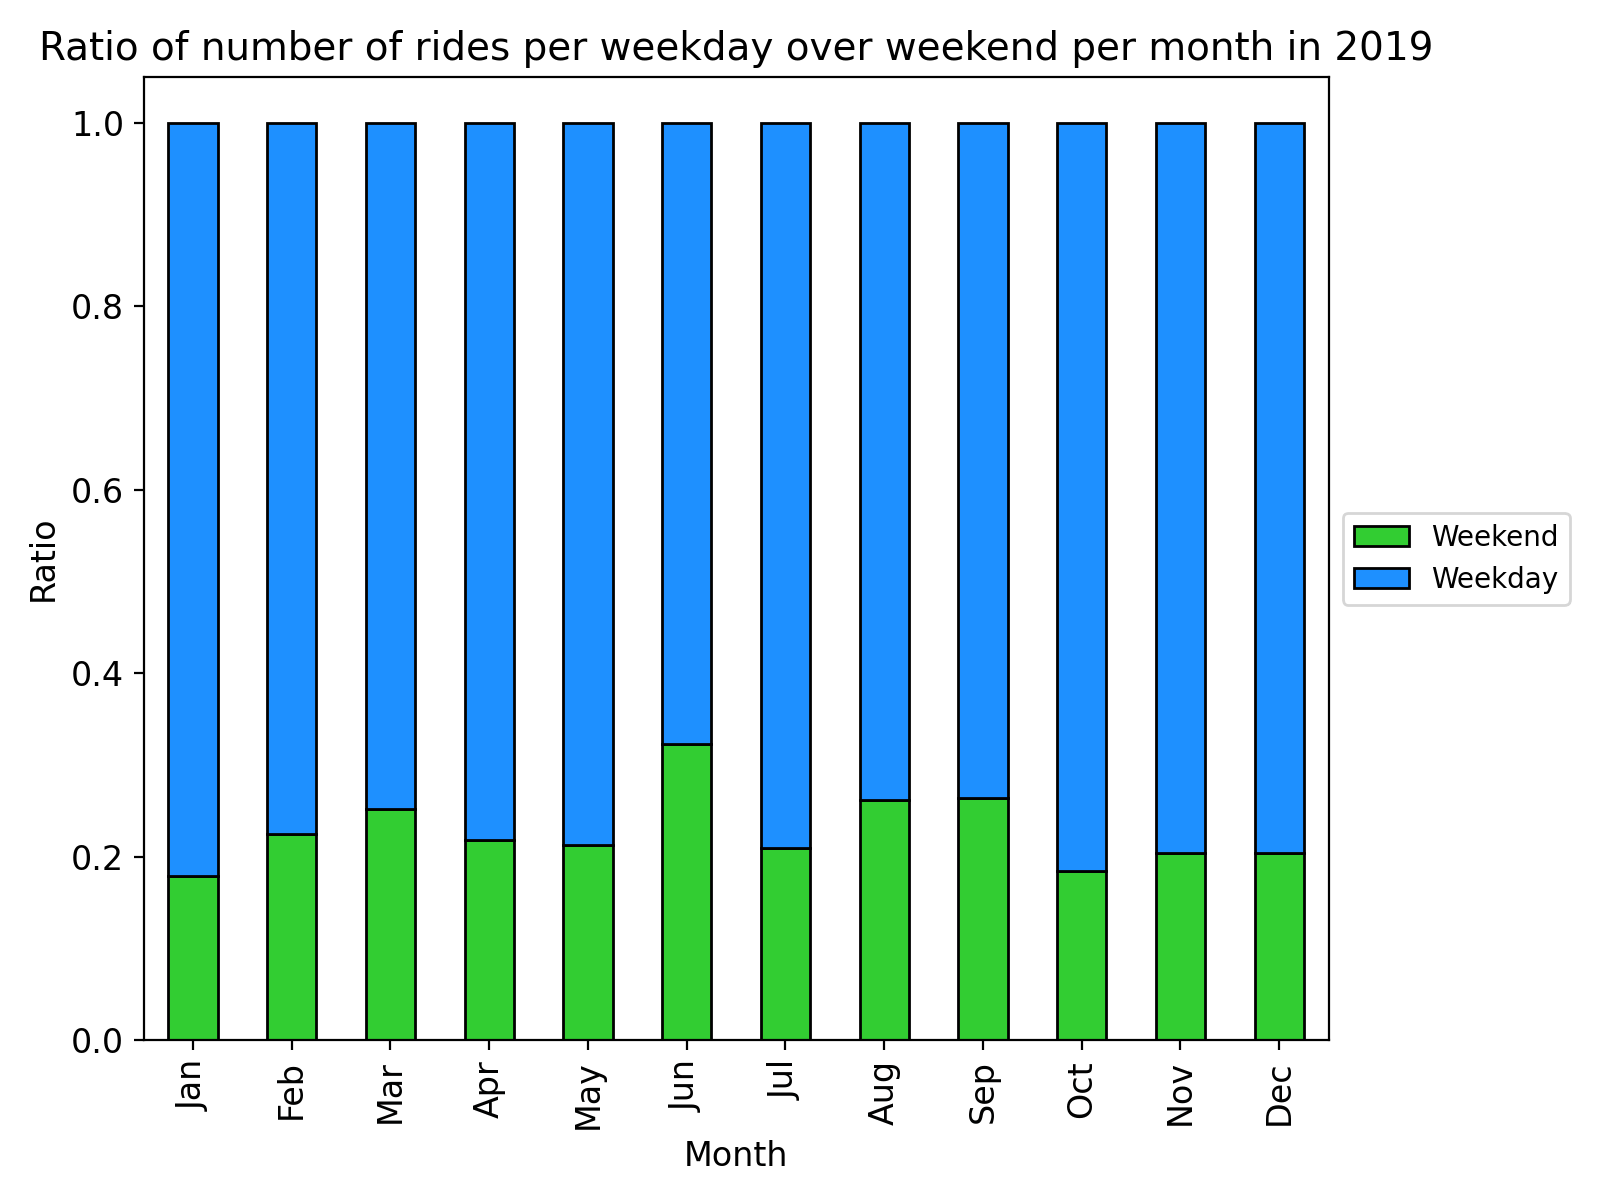
Figure 5 – Ratio of the number of rides per month for 2019.
The next plot in Figure 6 shows the effect of bicycle hires during weekdays, where there are two peaks occurring during the morning rush hour around eight o’clock and during the evening rush hour around six o’clock. Moderate bicycle use can be seen between the two peaks, while the lowest lull in bicycle use occurs naturally over the hours of the night.
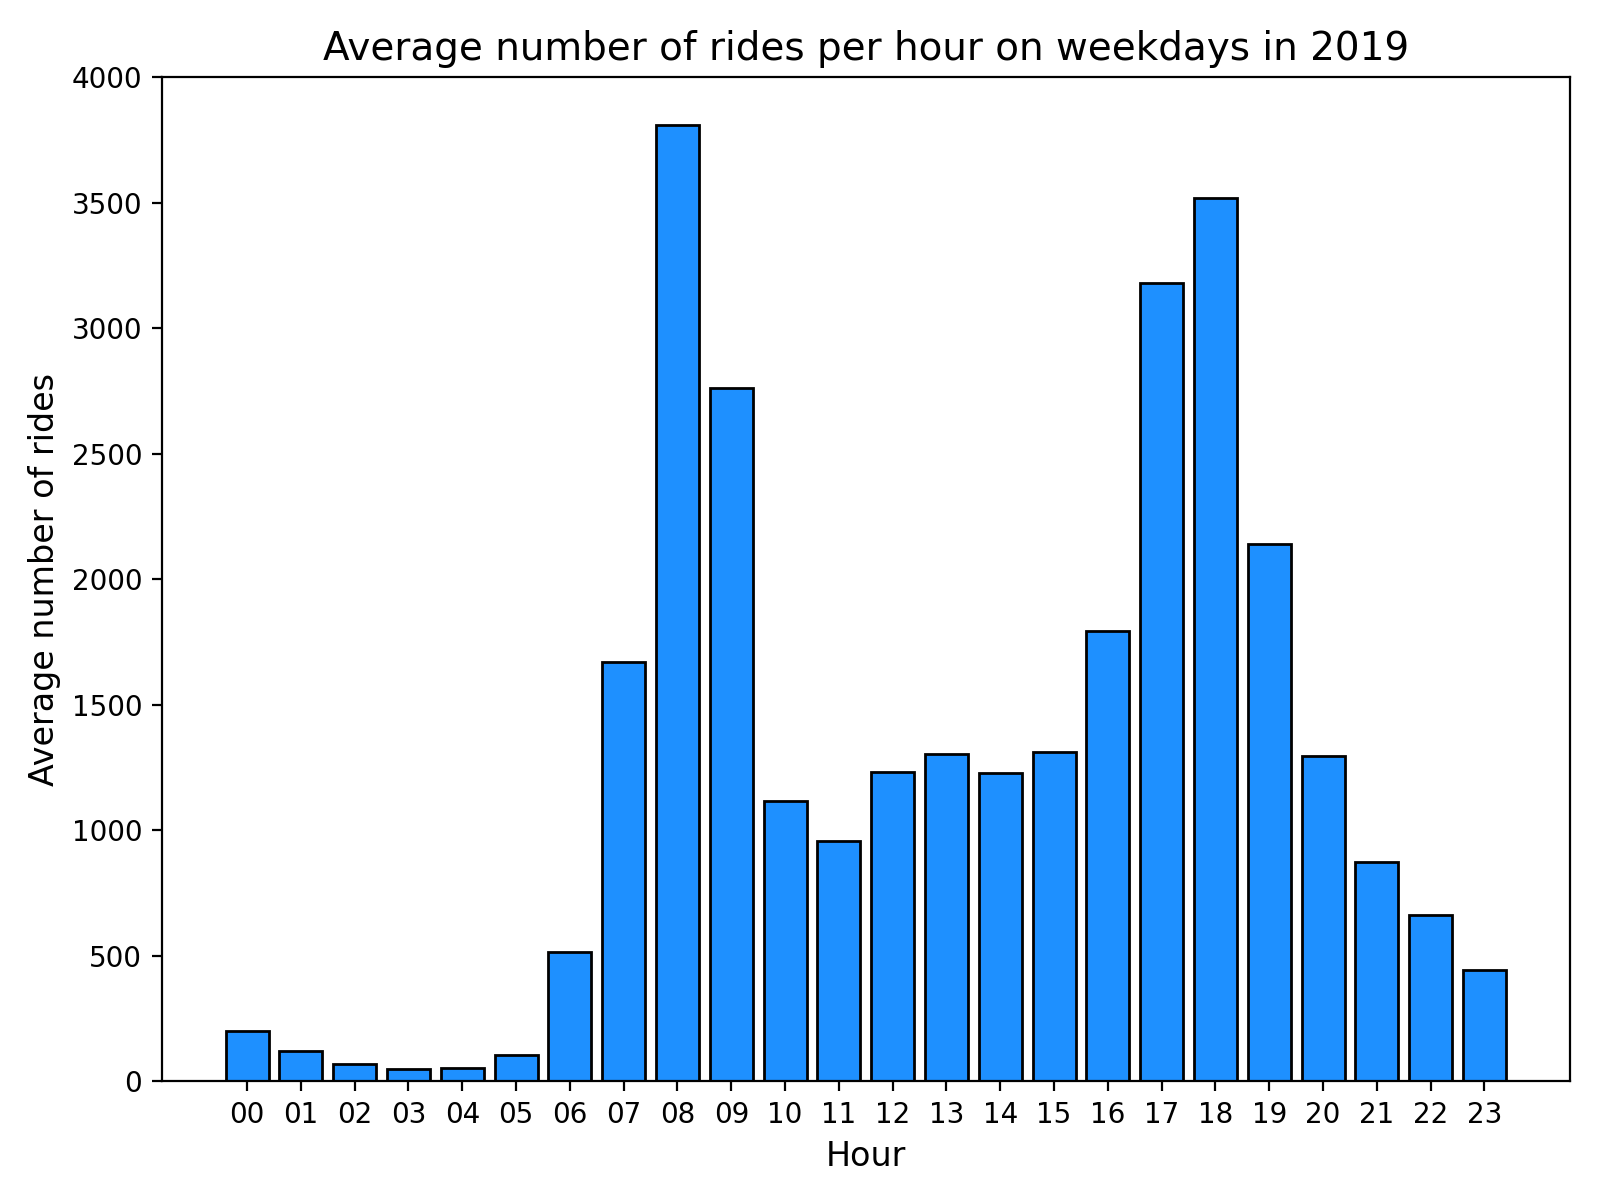
Figure 6 – Average number of rides per hour on weekdays in 2019.
A different behavior can be observed during the weekends (Figure 7), where there is a slow increase in bicycle use from the morning hours until reaching the peak in the afternoon around two to three o’clock with a slow decrease afterwards.
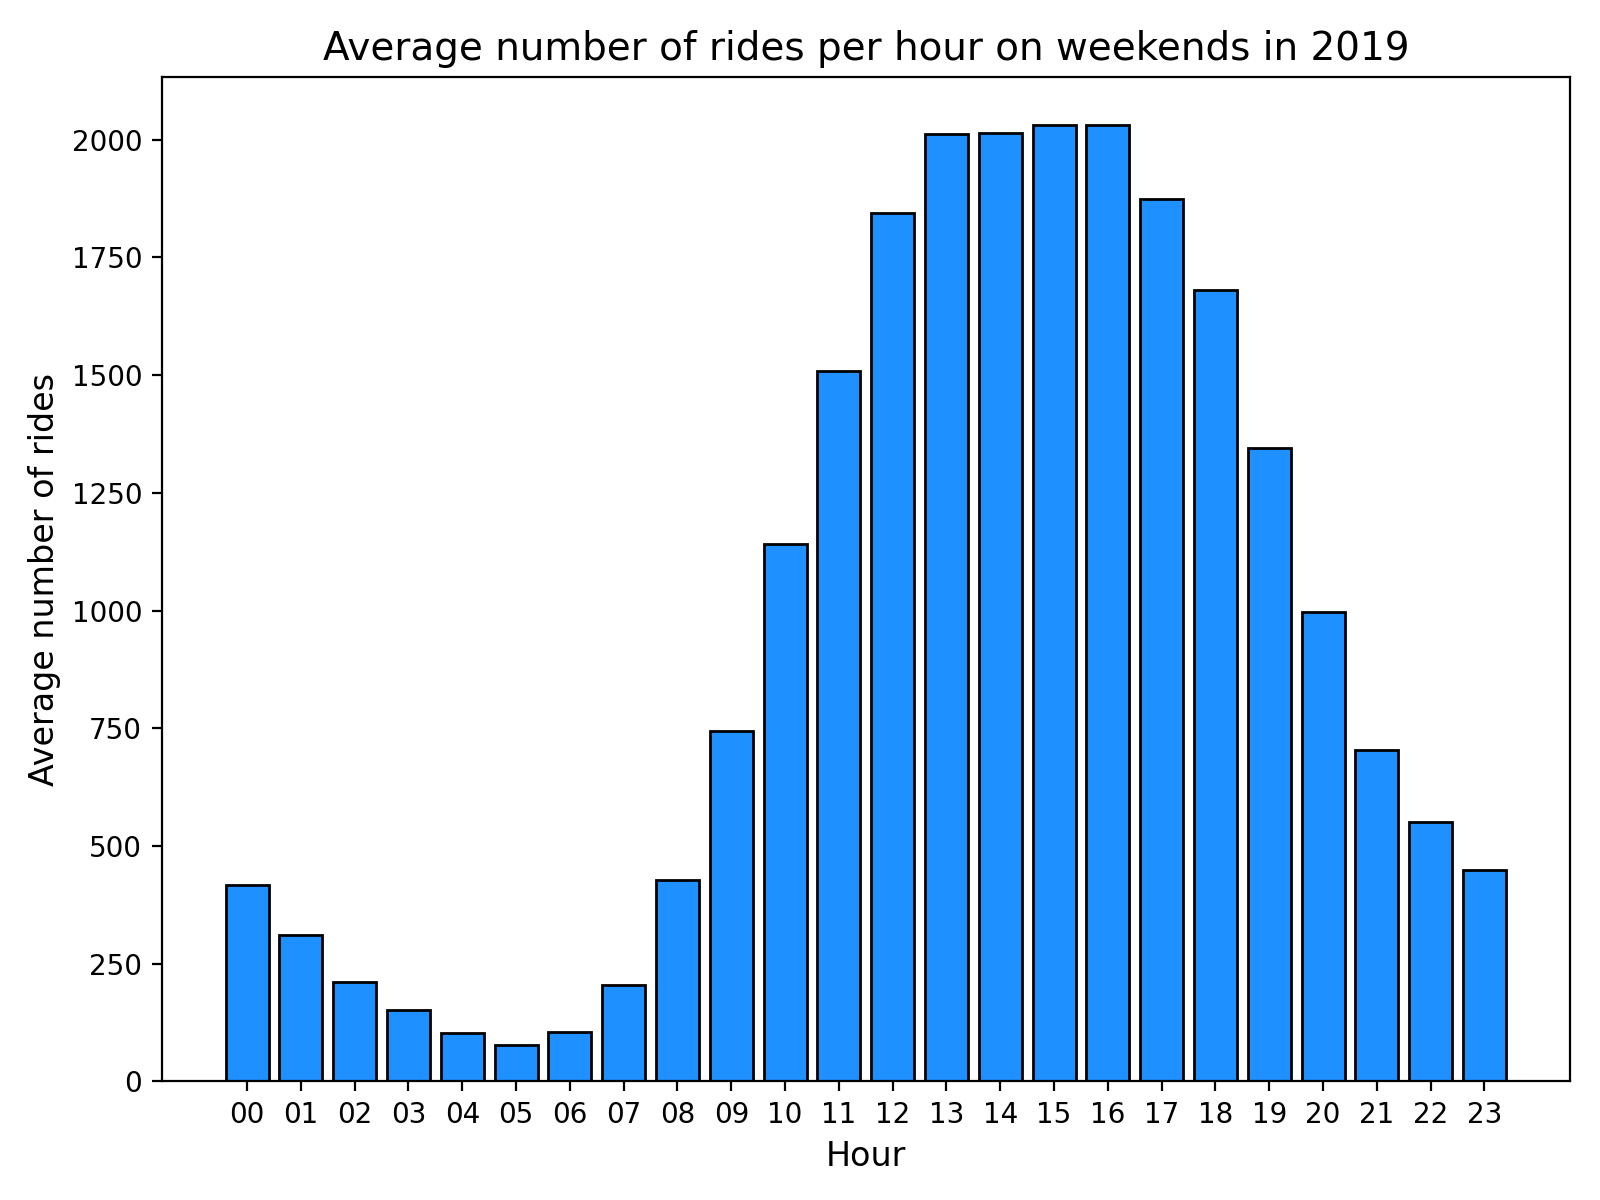
Figure 7 – Average number of rides per hour on weekends in 2019.
For the data analysis I used SQLite, pandas and Python (version 3.x), while for the plots I used matplotlib. The cycling data are available as CSV files directly from TfL, as part of the TfL policy for open data users. The Python code for these plots are on my GitHub repository.