Summary #
By using publicly available cycling data from TfL, it is easy to show the difference in public bicycle usage by Londoners during the first five months of 2019 and the first five months in 2020 during the COVID lockdown period.
Description #
The public bicycle share scheme in London has enjoyed an overwhelming success since its introduction in July 2010. The program is currently at its tenth year and has proven to be very popular among Londoners who now as of July 2020 have access to 781 docking stations and over 12,000 bikes throughout the city. However due to the lockdown caused by the COVID pandemic there has been a distinct change in the frequency of use of public transportation by city residents, and cycling has followed this trend as well.
Using the public cycling data made available by TfL, a bar plot of the monthly cycling usage for the first five months of 2019 and 2020 is shown below in Figure 1, highlighting both the weekday and weekend use of bicycles over this period. What can be noticed is a sharp drop in the monthly bicycle usage over the course of the lockdown, especially for what concerns the months of March and April compared to the same months in 2019.
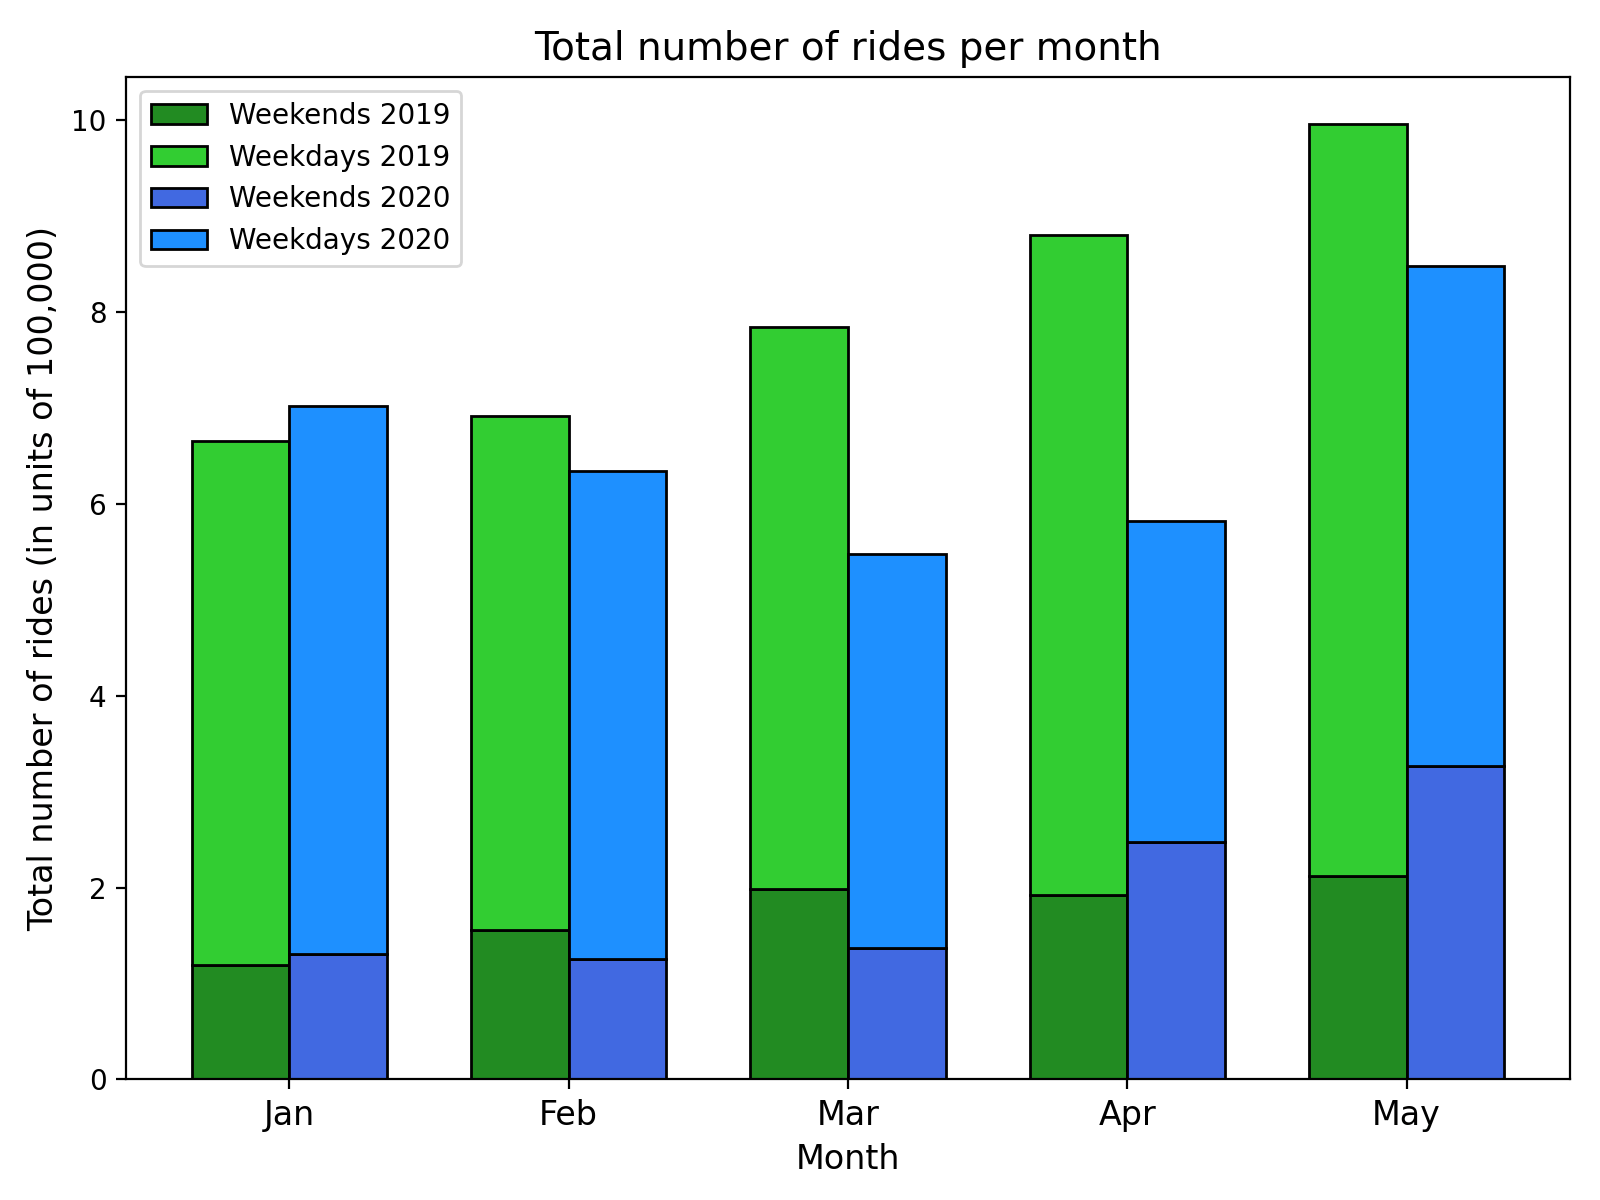
Figure 1 – Total number of rides per month
However, in the month of May we notice that the bicycle usage decisively reverses its trend and starts returning to pre-lockdown levels. The return to normal was also mentioned in a recent TfL press release, where the last week of the month of May reached the highest ever number of hires for a single week, and the highest ever number of hires for a single weekend. Things are slowing catching back to normal.
You can find the Python code for this plot on my GitHub repository.