Summary #
The goal of this machine learning project is to understand which distinct conditions and characteristics were to blame for the buildings that sustained the most damage from the Gorkha earthquake in Nepal, which on April 25, 2015 caused thousands of deaths and extreme hardship for all of the survivors, as well as massive damage to the country’s public buildings, infrastructure and private households.
Introduction #
One of the main appeals of machine learning is that one can immediately start making fairly good data predictions without having extensive domain knowledge on the subject at matter, which at times can produce unexpected and surprising insights. This happens to be the case concerning the machine learning data set available at DrivenData on the 2015 Gorkha earthquake in Nepal.
The level of damage reported in the data set is recorded by three ordinal variables, low, medium and high, the last one of which corresponds to near complete destruction. The measure of performance of the algorithms on the data set is given by the micro averaged F1 score, which is a variant of the F1 score. The F1 score is the harmonic mean of the precision and recall of a classifier. Conventionally it is used to evaluate performance on a binary classifier, but due to the three ordinal variables the micro averaged F1 score is employed here.
Exploratory data analysis #
First of all, it’s necessary to perform some exploratory data analysis of the features, the majority of which are categorical. The complete list of features present in the data set can be view on the specific DrivenData website. The following plot shows the damage sustained by the buildings from the earthquake according to the three damage levels. To take into account the different ratio of damage levels in the training labels of the data, the class imbalance is treated by using Scikit-Learn’s StratifiedShuffleSplit class which samples the training data in the same ratio as present in the training labels.
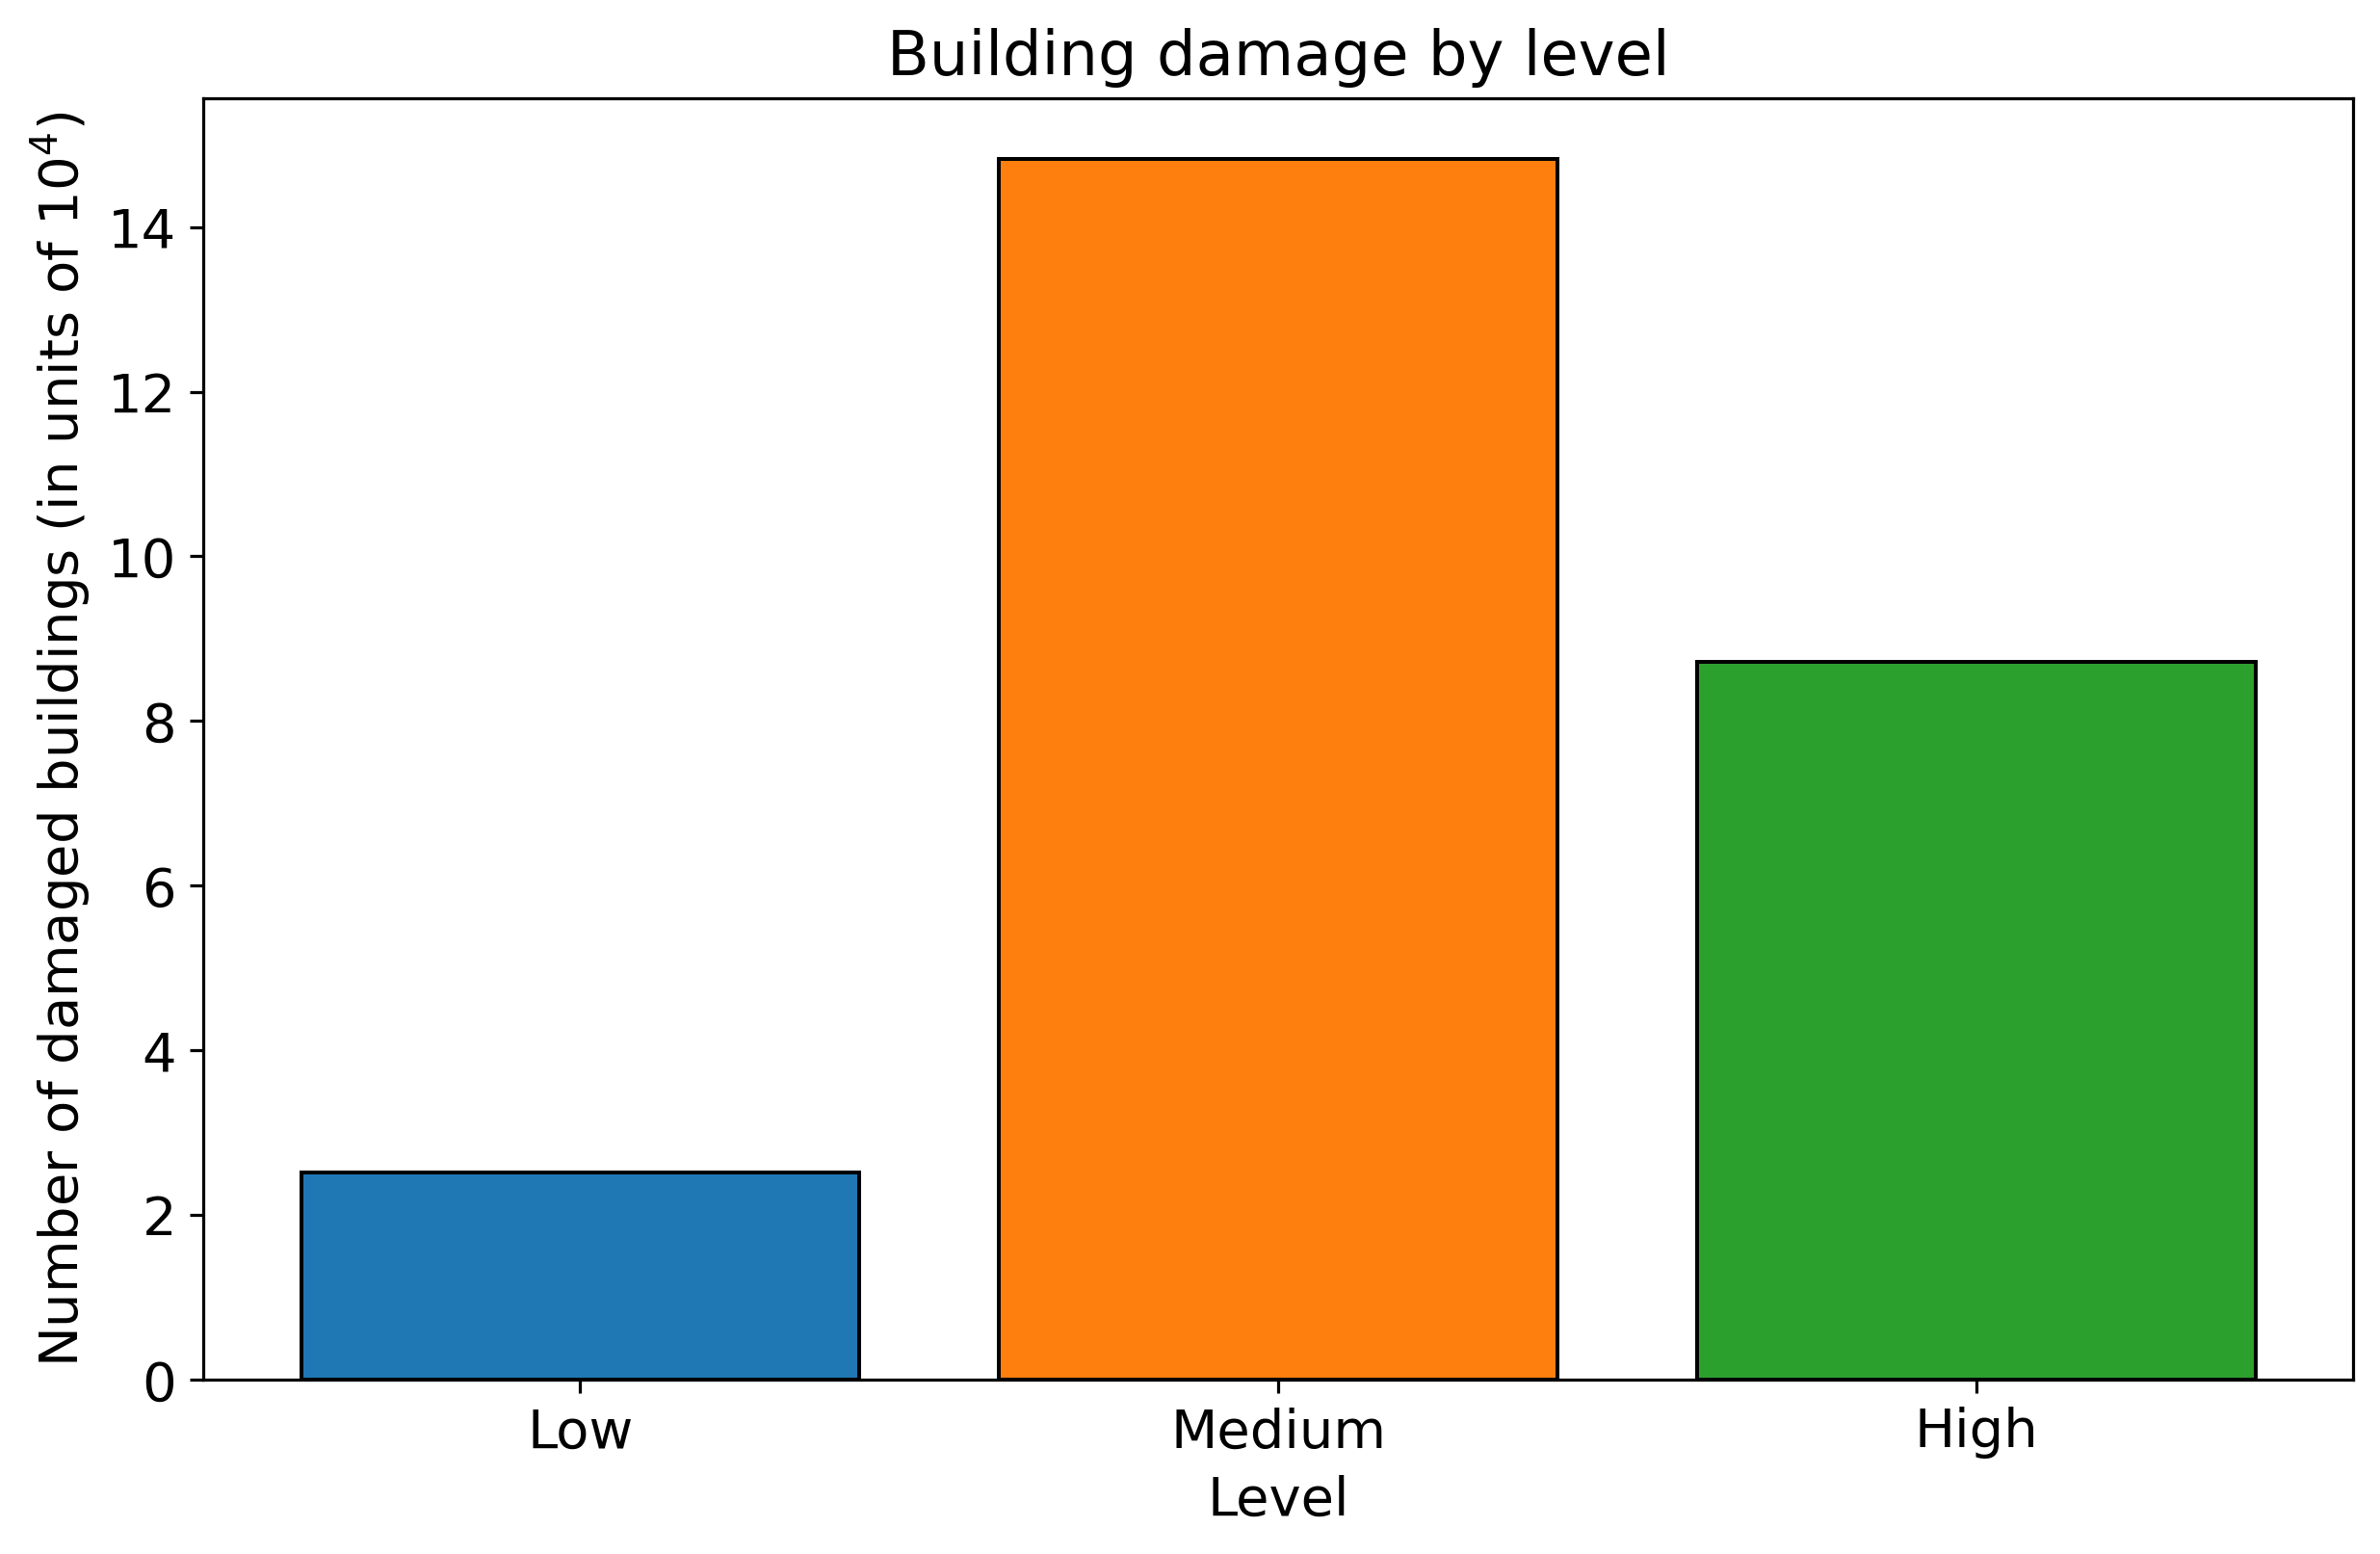
Figure 1 – Building damage by low, medium or high level.
As mentioned, most of the variables are categorical. Several of these are shown in the bar plot below. There appear to be a number of labels in each category that stand out from the others, such as the r label in the foundation_type plot or the s in position.
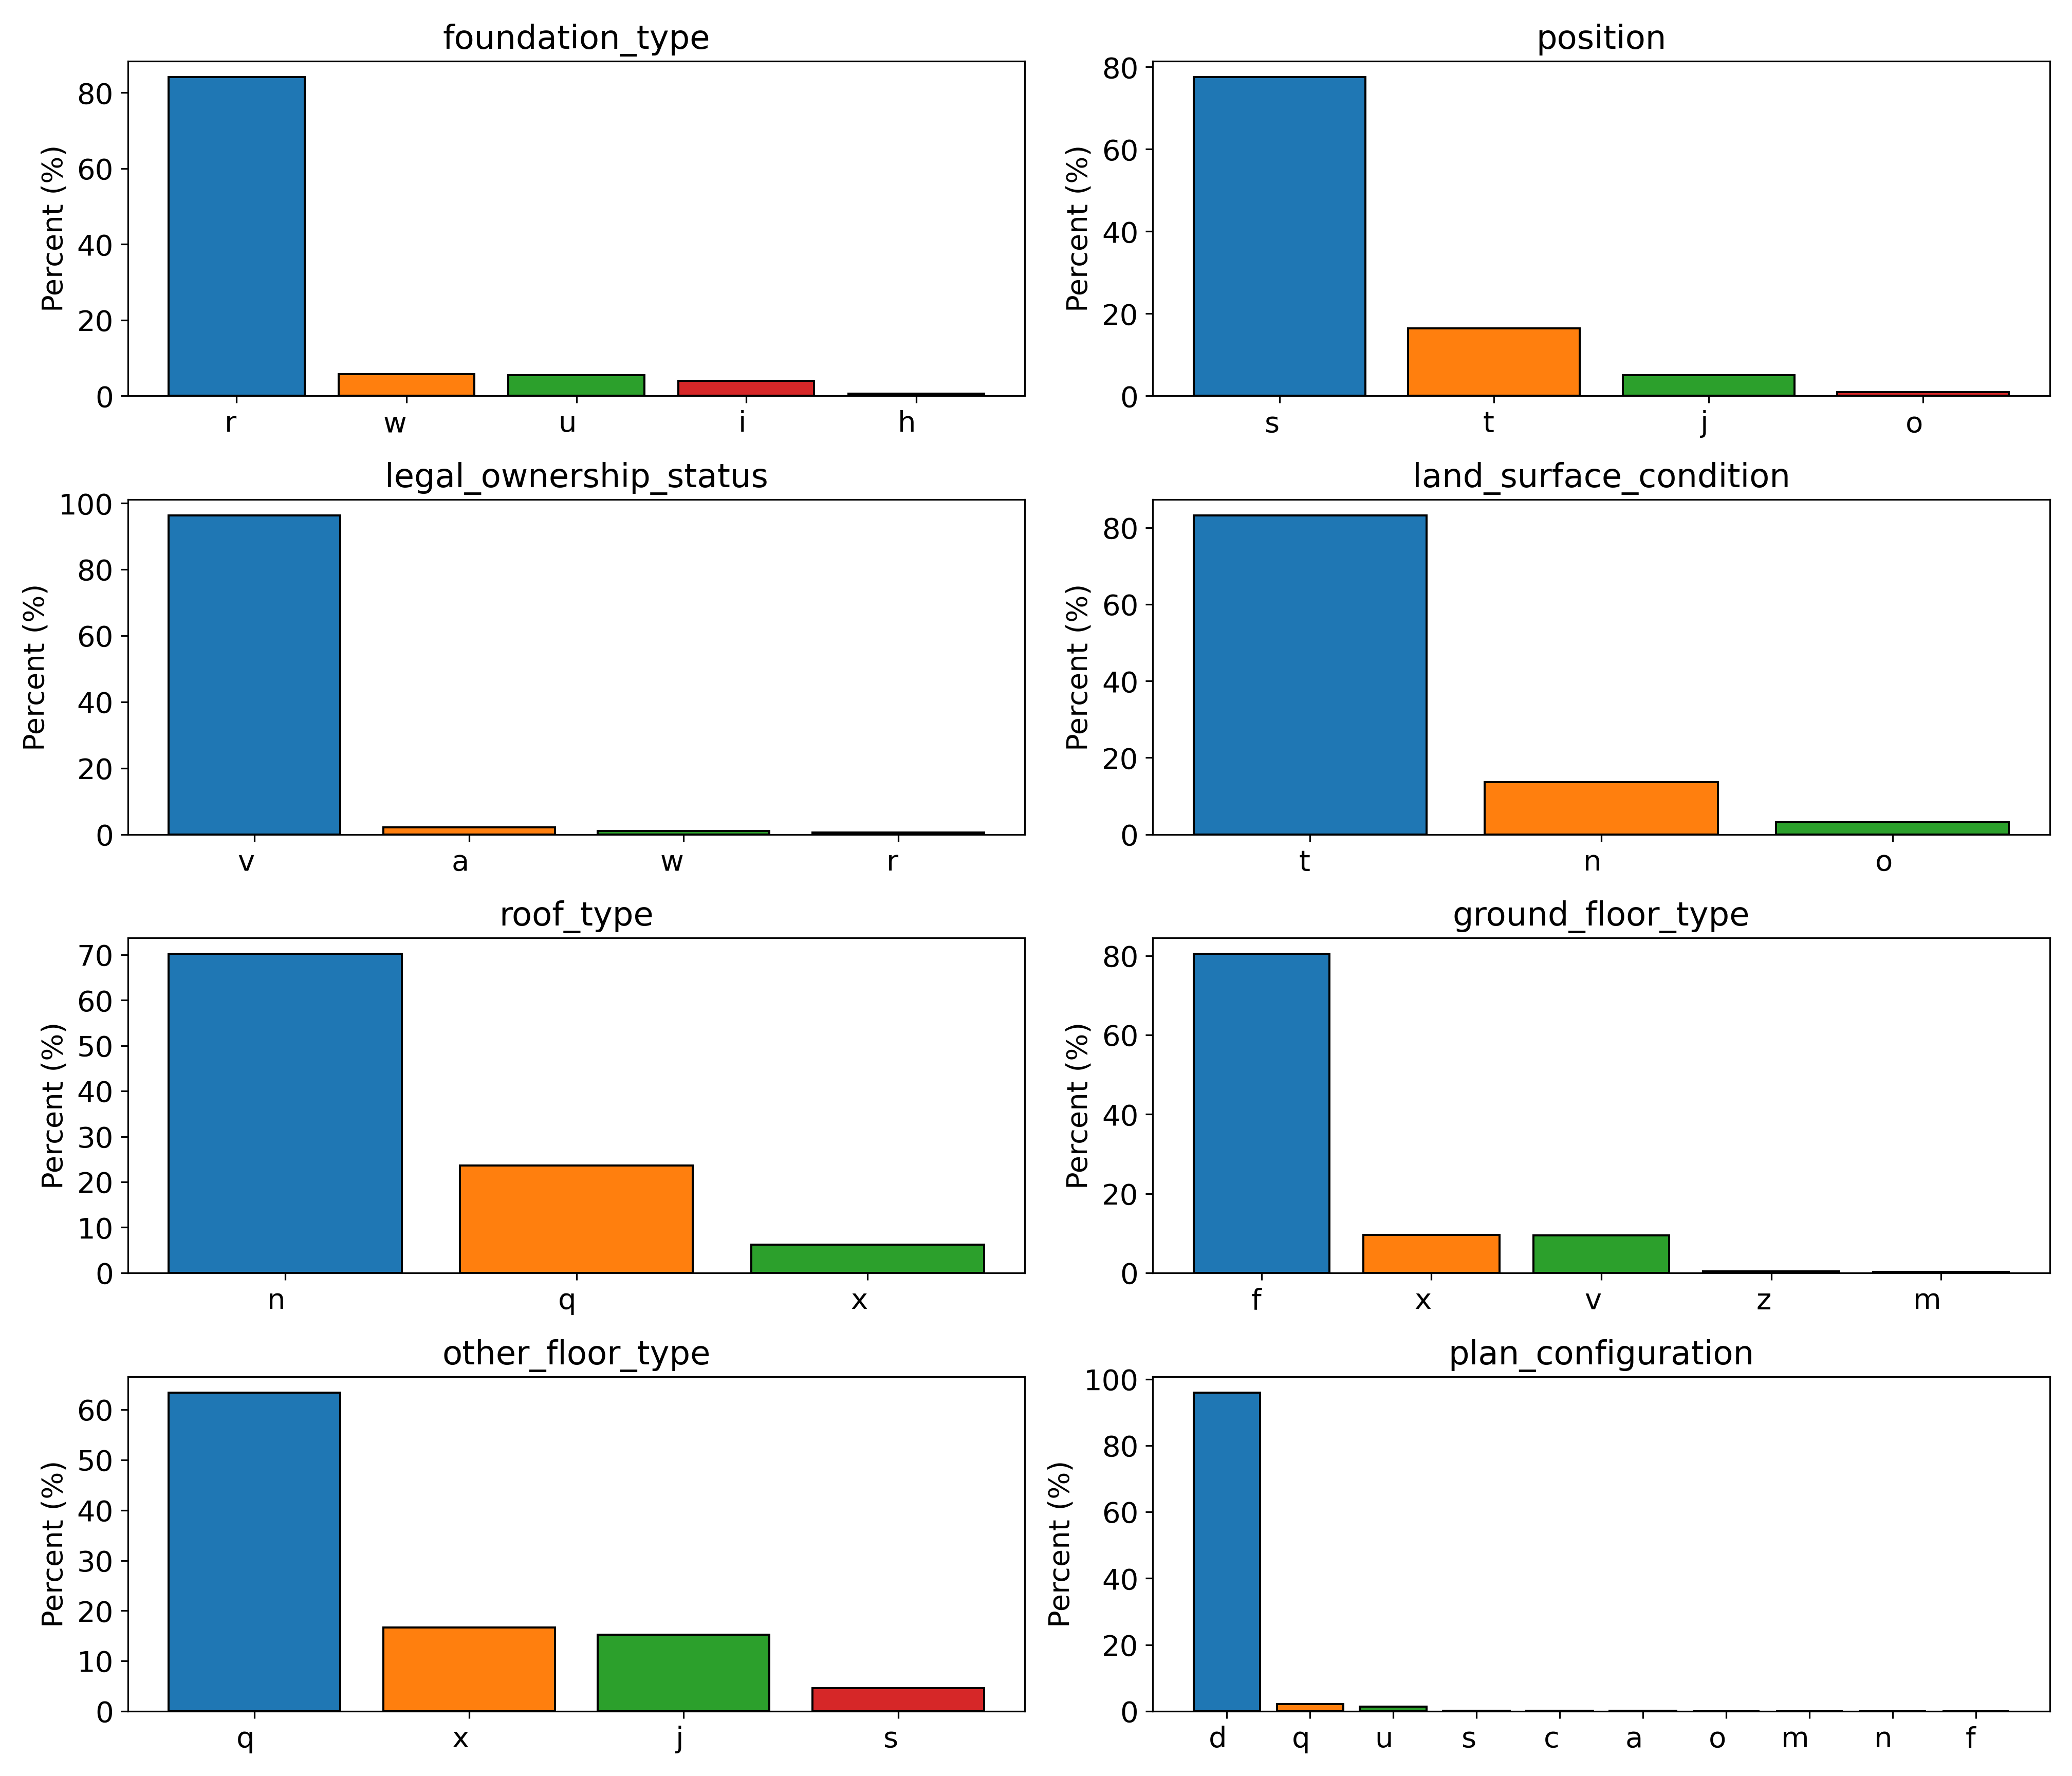
Figure 2 – Breakdown of main categories into sub-categories.
To confront the significant amount of categorical features in the data set, the category_encoders (2.2) package from the scikit-contrib repository is employed here. With this package a noticeable accuracy improvement with the TargetEncoder class is found. As explained in the documentation, “for the case of categorical targets, [the] features are replaced with a blend of [the] posterior probability of the target given particular categorical value and the prior probability of the target over all the training data”. This particular feature engineering allows for greater separation of the categories during model training, and consequent improvement in model prediction power.
Correlation plot #
For the five numerical variables a correlation plot has been generated to investigate any dependencies among variables. Beside an unsurprising relationship between number of floors in the building before the earthquake, count_floor_pre_eq, and the normalized height of the building area, height_percentage, there are no other obvious correlations that jump to the eye.
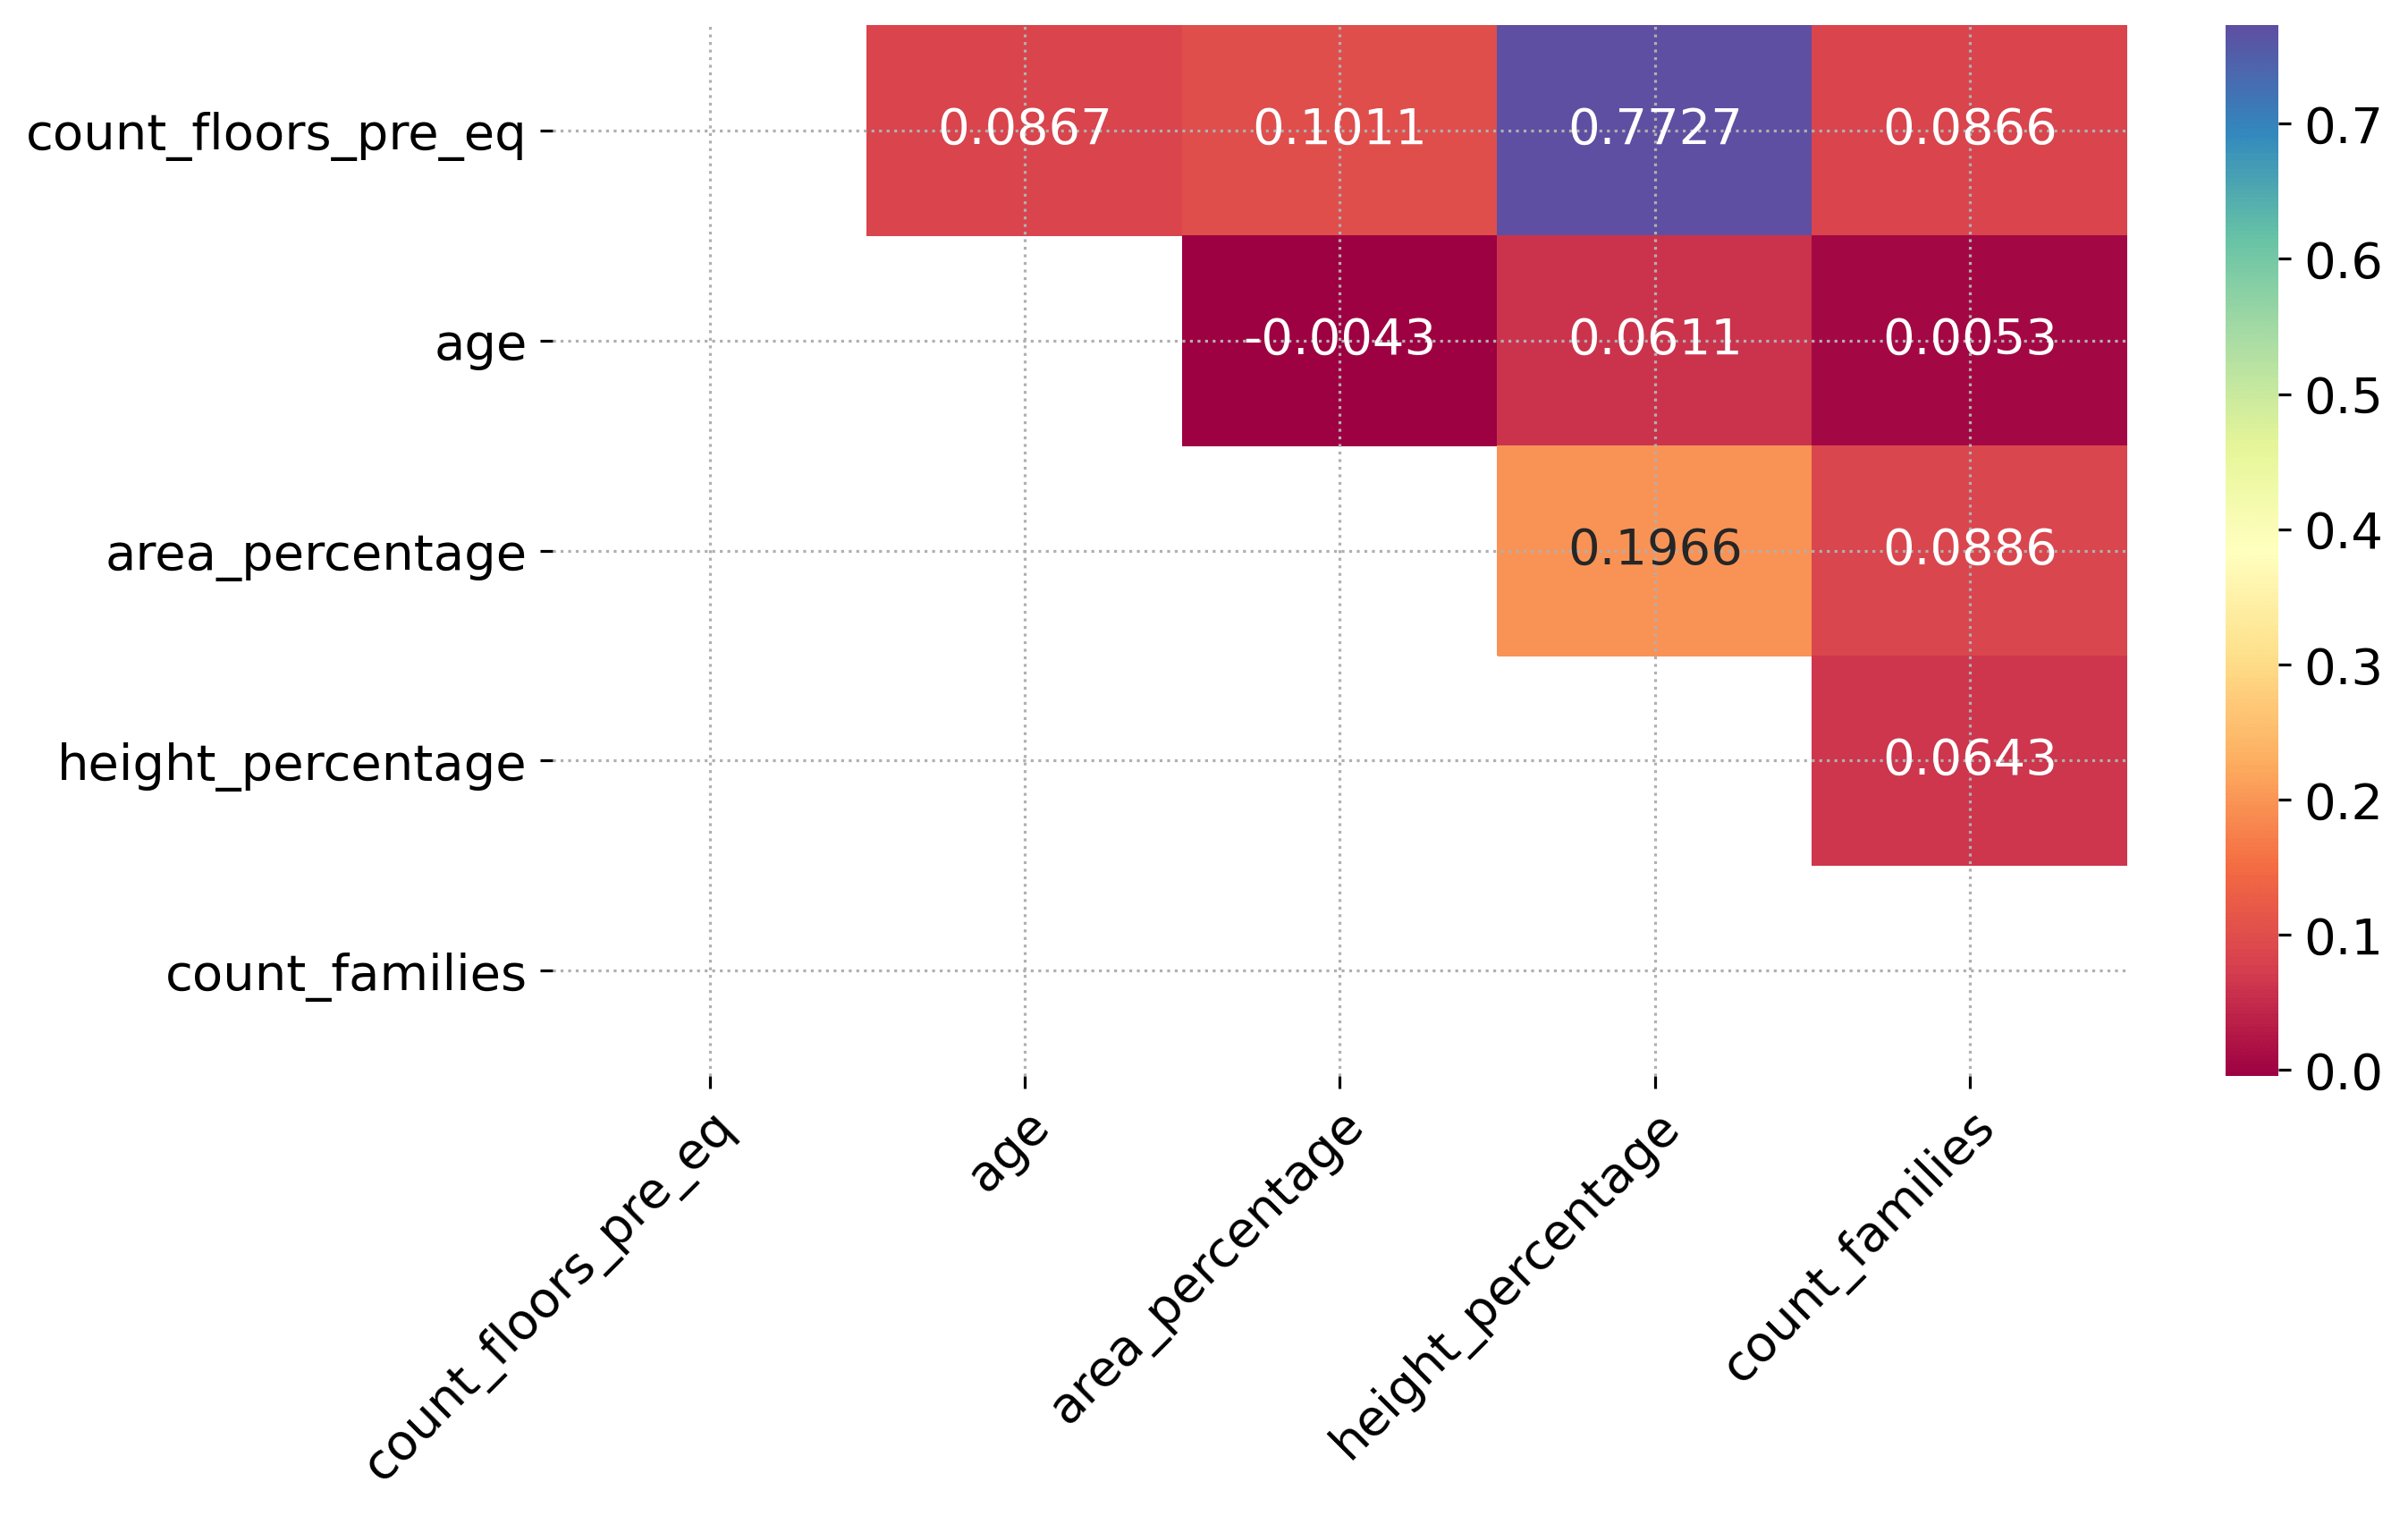
Figure 3 – Correlation plot of numerical factors.
Pair plot #
Even when a breakdown of the numerical variables according to damage level is performed, besides the obvious relationship between height_percentage (height normalized to building surface area) and count_floors_pre_eq (number of floors in the building prior to earthquake), no other prominent relationships can be gleaned from the scatter plot, as shown below.
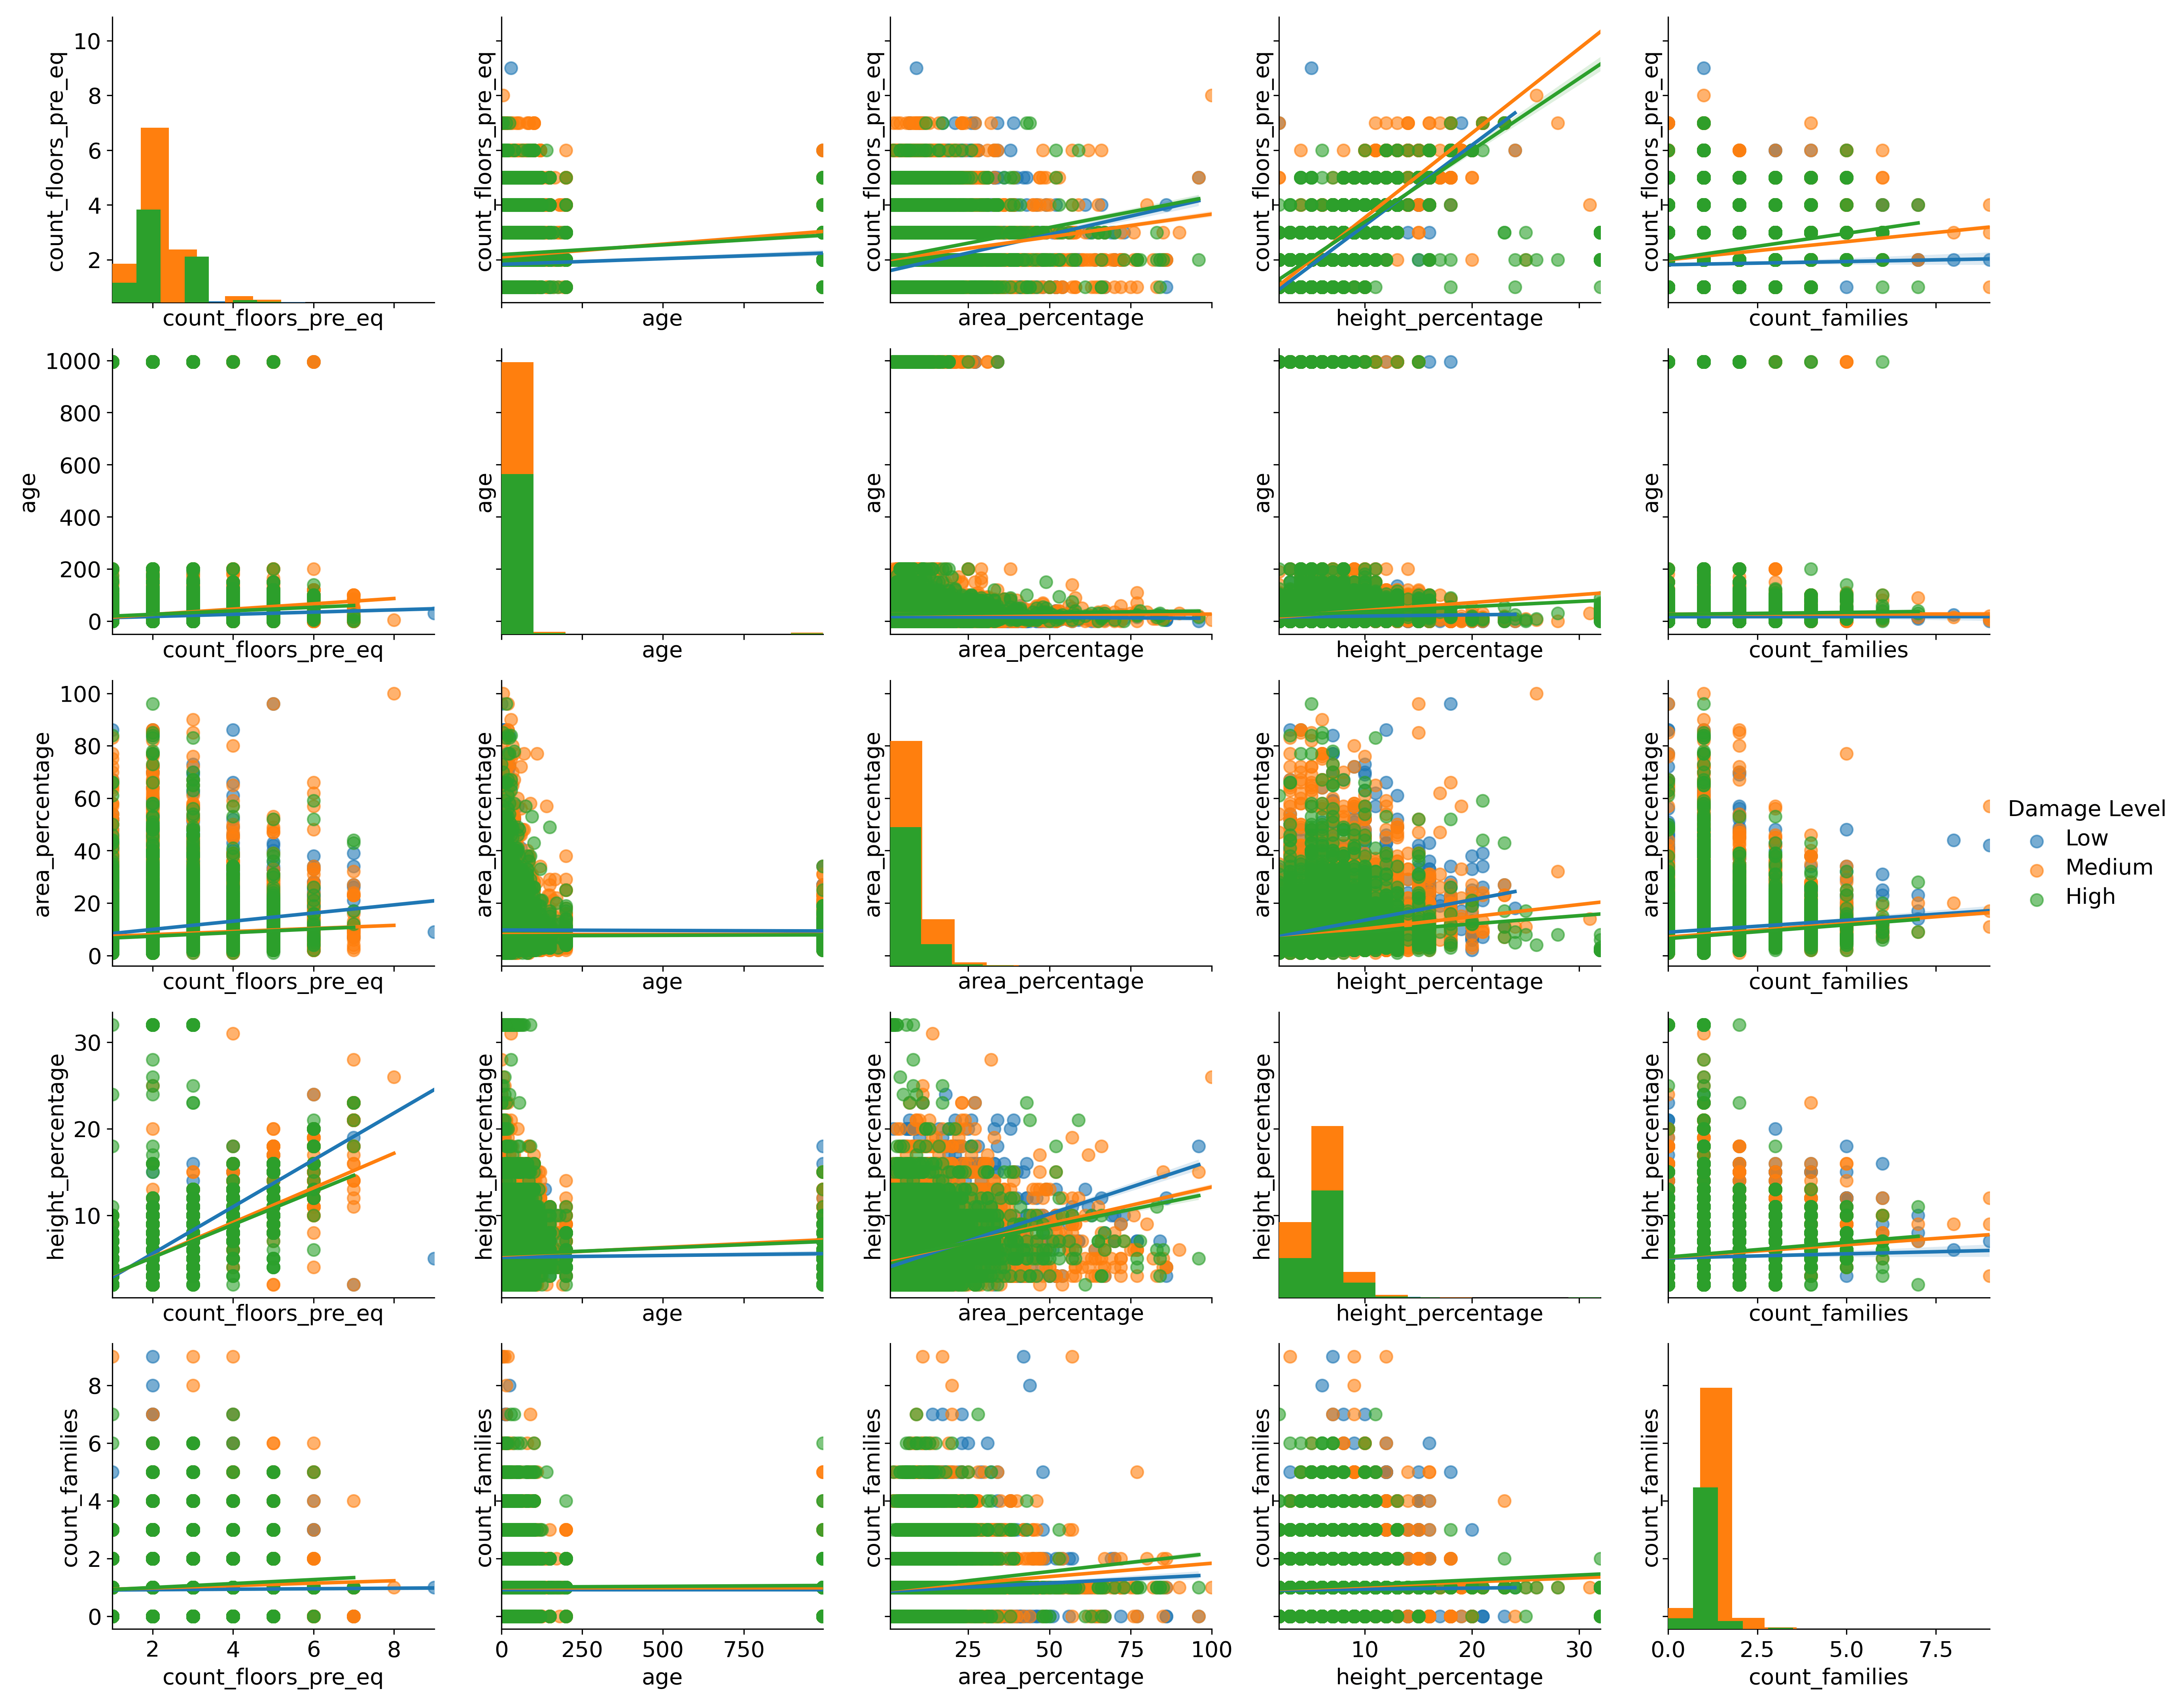
Figure 4 – Pair plot with regression lines according to damage level.
Enter ensemble learning #
Ensemble learning is a machine learning technique that has been very successful in many machine learning competitions, and when employed properly the increase in prediction accuracy can be quite remarkable. The principle idea is to build a prediction model from the combinations of different weak learners. A weak learner is lower-performing learner that performs barely better than random. The greatest benefit of ensemble learning comes from using learners that are as diverse as possible from one another, which in turn will assure us that their errors are also very different as well.
Scikit-Learn offers the VotingClassifier class which allow the combination of classifiers into an ensemble model with greater model prediction than that given by the individual learners. The model training was performed over the entire data set, made up of 260,601 records and 38 features.
The learners that were employed in the analysis were actually fairly high in prediction power themselves, and were the RandomForestClassifier, CatBoostClassifier, XGBClassifier and SGDClassifier classifiers. The first three classes are ensemble learners in their own right. For the VotingClassifier class the voting=soft option was employed, which uses the class with the highest probability as the prediction.
Confusion matrix heat map #
The following plot illustrates the confusion matrix heat map for the actual and predicted damage levels for the buildings of our model. The results of the confusion matrix are normalized by the sum of the results along each row. The greater part of the buildings are properly predicted along the main diagonal, with a lower amount of building misclassified off the main diagonal.
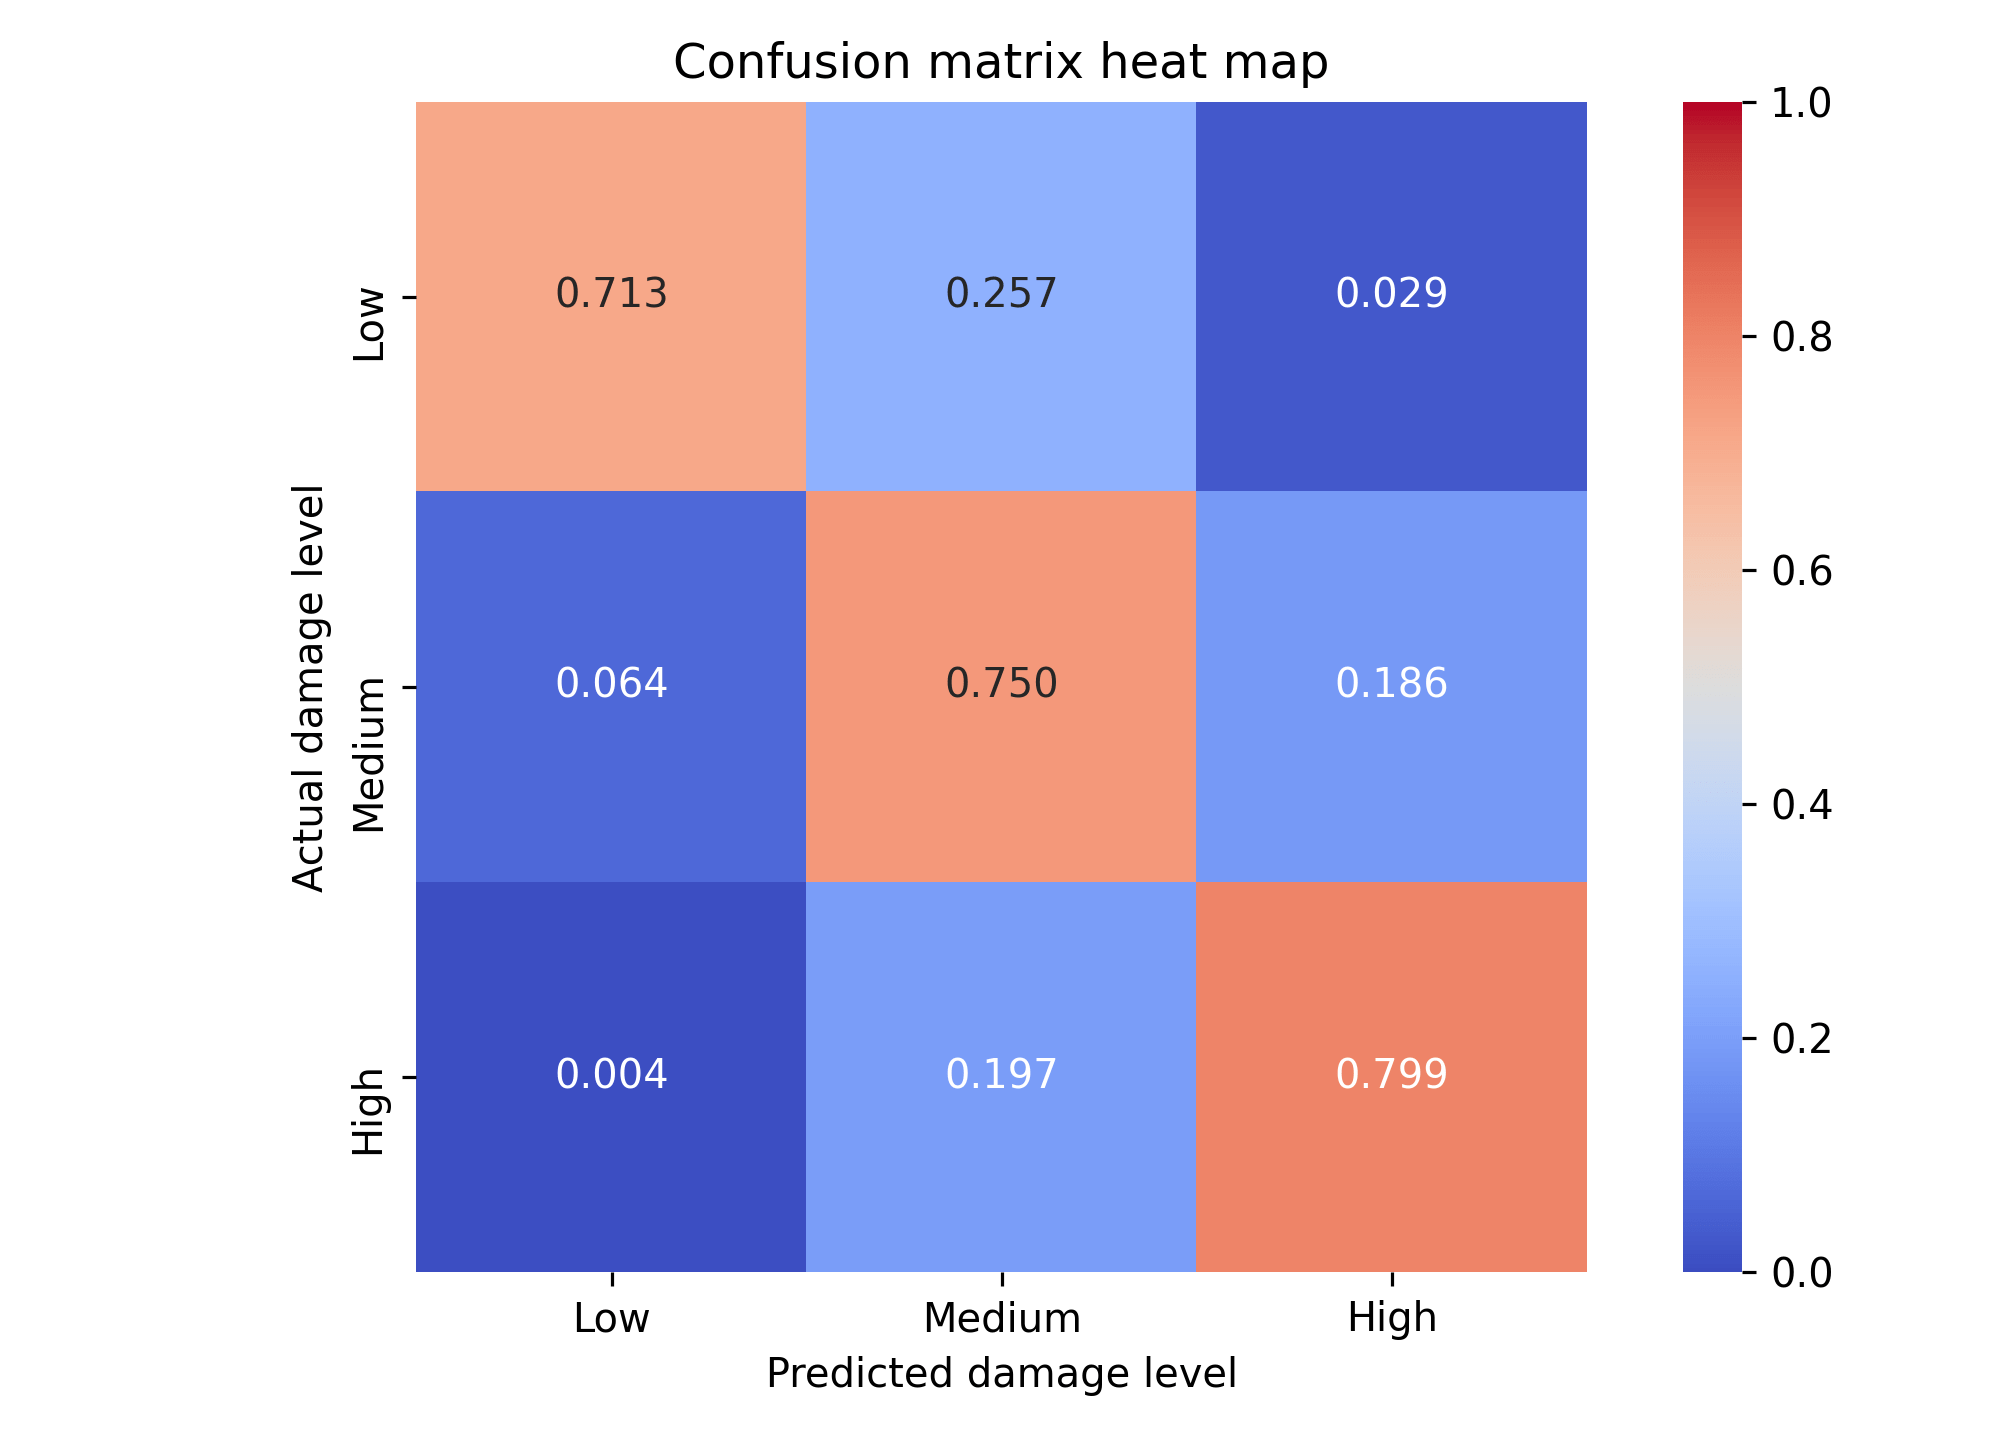
Figure 5 – Confusion matrix heat map for actual and predicted damage levels of buildings.
Result #
As of the date of posting, for the specific DrivenData competition this technique was able to achieve a micro averaged F1 score of 0.7498, which places it in the 98th percentile of the leaderboard ranking.
You can review the Python code on my GitHub repository at capac/predicting-earthquake-damage. Most of the code makes use of latest version of Scikit-Learn (0.23.2), but also of the CatBoost (0.24.2) and XGBoost (1.2.0) gradient boosting packages.