The focus of this analysis is to build a predictive tool that strives to determine the features of posts that are likely to cause user engagement on social media.
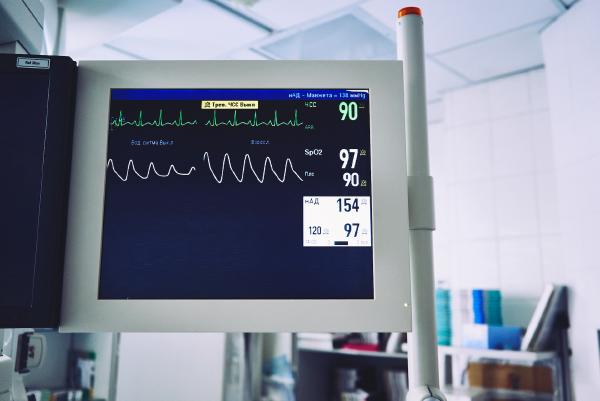
This data analysis generates a predictive model that can forecast the agents that may be responsible for unplanned hospital readmissions of people affected by diabetes.
This project aims to understand which distinct conditions and characteristics were to blame for the buildings that sustained the most damage from the massive 2015 Gorkha earthquake in Nepal.
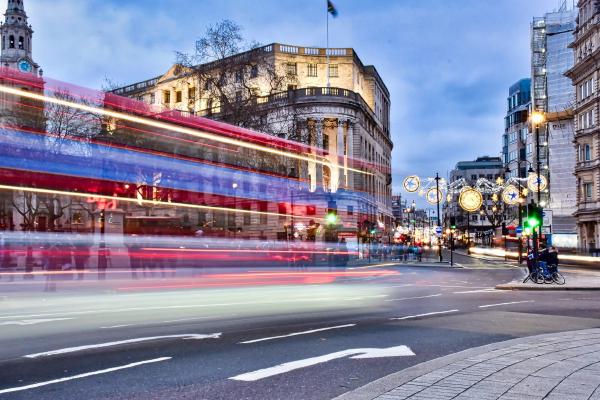
I’ve dedicated some time to build an interactive scatter plot with Bokeh to show the average weekday traffic of public city bicycles in London UK in 2019.
Using the public cycling data made available by TfL, I show the monthly cycling usage for the first five months of 2019 and 2020, which displays the change in cycling habits before and during the COVID lockdown.
This interesting project in exploratory data analysis shows the bicycle usage by London city residents for 2019, using data that is freely available for public consumption on the TfL web site.